To determine the number of each temperature threshold day, the regional model data is disaggregated, i.e. the low-resolution regional data is broken down into finer spatial detail (Fig. 1). For the FITNAH data, the difference between the temperatures (Tmin or Tmax) and the global average is calculated at each grid point. These differences are offset against the results of the regional model ensemble using an empirical correction factor. This process generates long-term, high-resolution daily minimum and maximum temperatures, allowing for a precise analysis of how many days within the observed periods meet the criteria for summer days, hot days, and tropical nights.
New
The Environmental Atlas maps are available in the new Map Application
Trends in the Number of Selected Temperature Threshold Days 2022
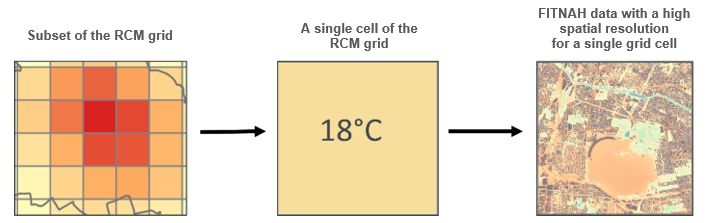
Fig. 1: Sample area of the regional climate model (RCM) grid point and the corresponding grid values from the high-resolution FITNAH modelling.
Image: Umweltatlas Berlin
The results show how often the individual temperature threshold days occur on average per year for three different time periods (the reference period from 1971 to 2000, a period in the near future from 2030 to 2061 and a period in the distant future from 2071 to 2100). Complementing the grid-based results, aggregated data and the projected increase in threshold days for future periods compared to the reference period from 1971 to 2000 are provided based on the ISU5 block segment areas. Please refer to the documentation for a detailed description of the methodology.
When calculating the number of threshold days for periods that lie in the future, the effects of climate change were taken into account. The calculations did not, however, account for urban planning and the implementation of adaptation measures.
Contact
Berlin Senate Department for Urban Development, Building and Housing
Mr. Dr. Brunnow
Environmental Atlas Contact
Berlin Senate Department for Urban Development, Building and Housing
Mrs. Haag