Surface Runoff, Seepage, and Total Runoff from Precipitation 1990

Methodology

A model for the most important parameters of water management has been developed, programmed and applied in recent years. This model was developed in cooperation with the Federal Institute of Hydrology (Bundesanstalt für Gewässerkunde). The approximately 25 basic data and initial parameters required for each of the 25,000 areas were furnished by the Environmental Information System EIS.

The runoff formation model ABIMO developed by Glugla originated on the basis of models developed since the 70´s for the calculation of groundwater supplies. This model was extended with components that consider the special situation in urban areas. This extension was made through expert opinions from the Institute for Ecology (Soil Science) of the TU -Technical University of Berlin, and it was supported by a thesis in geography at the FU – Free University of Berlin. A computer realisation performed by an external software office fitted it to the special data situation in Berlin.

The calculation procedure initially determined actual evaporation in order to calculate total runoff (precipitation minus evaporation). A second step determined surface runoff as part of total runoff. The difference between total runoff and surface runoff gives percolation. Fig. 2 gives an impression of the complexity of the procedure.

Fig. 2: Flow Diagram of the ABIMO Model

Fig. 2: Flow Diagram of the ABIMO Model

Fig. 2a: Content of symbols to the flow chart ABIMO

Fig. 2a: Contents of symbols of the flow diagram of the ABIMO model

Total runoff is calculated from the difference between long-term annual mean precipitation and real evaporation. Real evaporation, as it actually occurs in means at specific locations and areas, is calculated from the most important influence parameters of precipitation and potential evaporation, as well as the mean storage characteristics of the evaporative areas. With sufficient introduction of moisture to the evaporative zone, real evaporation approaches potential. Real evaporation is additionally modified by the storage properties of the evaporative zones. High storage capacity (such as greater binding quality of soil and greater rooting depth) causes greater evaporation.

The demonstrated connection between long-term mean values of real evaporation, on the one hand, and precipitation, potential evaporation, and evaporative effectivity of the location, on the other hand, satisfies the relation according to Bagrov (cf. Gluga et al. 1971, Gluga et al. 1976, Bamberg et al. 1981, and Fig. 3). The Bagrov relation is based on the evaluation of long-term lysimeter studies. It describes the non-linear relation between precipitation and evaporation in dependence on local properties. With knowledge of the climate parameters precipitation P, and potential evaporation EP (the quotient of P/EP), and the effectivity parameter n, the Bagrov relation can determine the quotient real evaporation / potential evaporation (ER/EP), and thus the real evaporation ER for locations and regions without groundwater influence. The Bagrov procedure is also used in modified form for the calculation of groundwater-influenced evaporation by allocating the mean capillary water inflow from groundwater to precipitation.

Fig. 3: Portrayal of the Bagrov Equation for Selected Values of the Parameters n and the Dependency of these Parameters on Land Use and Soil Type

Fig. 3: Portrayal of the Bagrov Equation for Selected Values of the Parameters n and the Dependency of these Parameters on Land Use and Soil Type

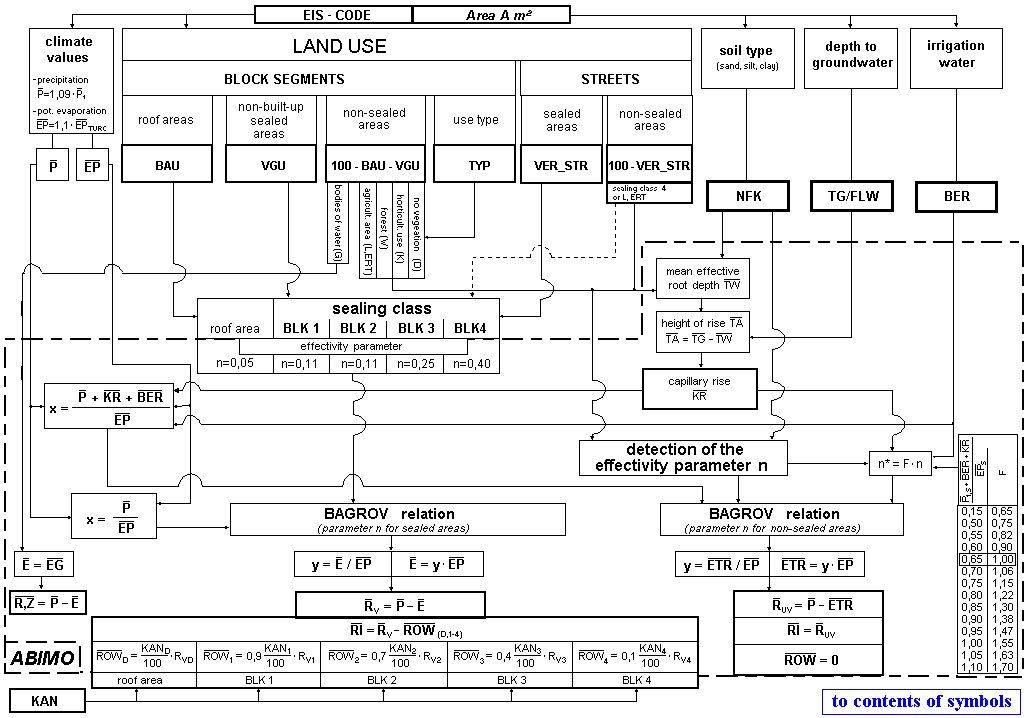
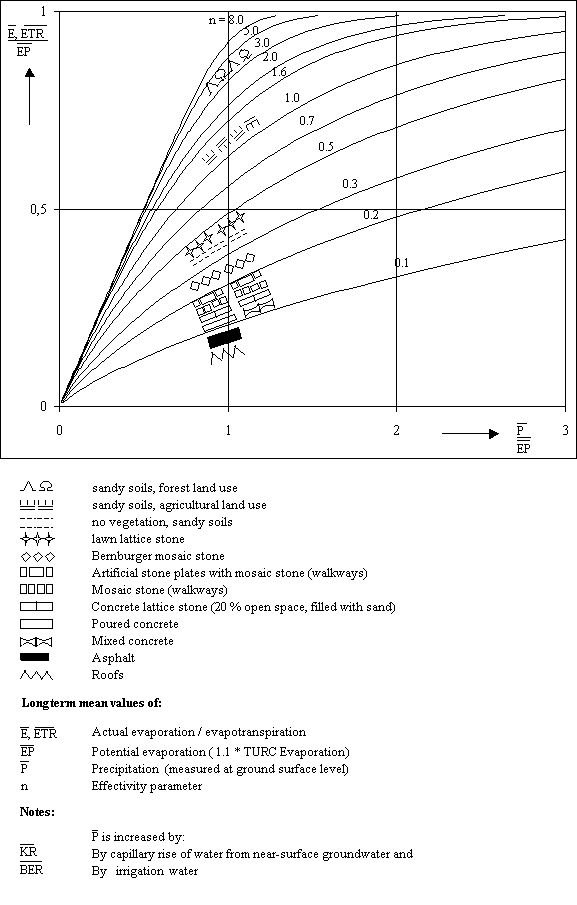
With increasing precipitation P, real evaporation ER approaches potential evaporation EP, e.g. the quotient ER/EP approaches a value of 1. With decreasing precipitation P, (P/EP approaches a value of 0), real evaporation ER approaches precipitation P. The intensity with which these frame conditions are achieved, is modified by the storage properties of the evaporative zone (effectivity parameter n).

Storage properties of a location are particularly influenced by the type of land use (increasing storage effectivity in the order of: sealed surfaces, soils without vegetation, agricultural, horticultural, and forest use) as well as soil type (increased storage effectivity with greater binding capacity of the soil).

A measure for the storage effectivity of unsealed surfaces is usable field-moisture capacity. It is defined as the difference between the moisture values of the soil for field capacity (water begins to infiltrate the soil) and for the wilting point (permanent damage to plants). Other land use factors modify the parameter value n. These factors include yield per hectare, and tree type and age. The parameter n is quantified by the evaluation of observations of numerous domestic and foreign lysimeter stations, and from water management studies in river catchment areas.

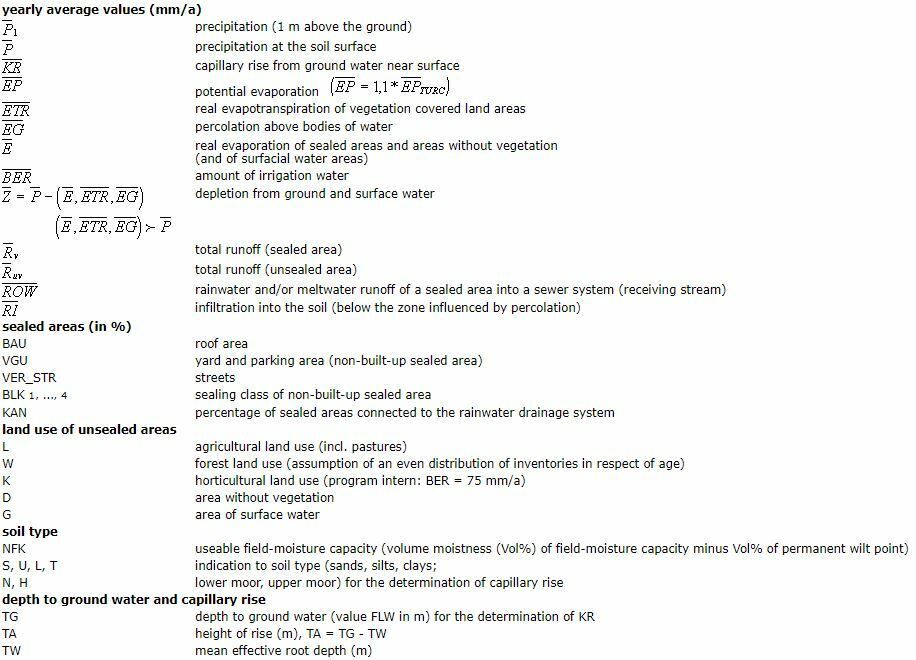
Locations and regions with near-surface groundwater have increased evaporation in comparison with conditions uninfluenced by groundwater. This is due to the capillary rise of groundwater into the evaporative soil zone, influenced by groundwater depth and soil properties. The formation of surface runoff flow is reduced. If real evaporation exceeds precipitation, there is water depletion. Values for surface runoff become negative, such as in river and lake lowlands.

Bodies of water show increased potential evaporation, in comparison to land areas. This is due to greater heat (lower reflective capacity for incoming radiation). Actual evaporation from bodies of water was equated with this increased potential evaporation, as an approach.

Percolation at specific points, such as at groundwater recharge plants of the water works, was not considered. Horticultural land uses (allotment gardens) were given a set value and added to precipitation, in order to give an approximate value for plant watering.

Mean total surface flow was calculated as the difference between precipitation and real evaporation. A second step then determined surface runoff. Surface runoff corresponds to total runoff for roof areas that discharge into the sewage system. Areas not connected to the sewage system do not produce overland flow. Non-built-up sealed surfaces infiltrate some of the discharge flow into the ground, depending on the type of covering material (surface sealing type). This infiltration factor depends on the type, size, and age of the joints. Depending on the degree of connection to the sewage system, surface flow which does not infiltrate is discharged as surface runoff by way of the sewage system, or infiltrates at the edge of the sealed surfaces. This is also true for roof areas not connected to the sewage system (cf. Tab. 1). The difference between total runoff and surface runoff thus corresponds to percolation as a parameter for groundwater recharge.

The application of this procedure for urban regions requires the determination of the parameters n and the infiltration factors of various sealing materials. Evaluations were made of lysimeter studies on various sealing materials, and of calculations for loss from wetting (cf. Wessolek/Facklam 1997). Selected dimensions for these parameters are listed in Tab. 2. Changes in these parameters related to the aging process, the thickening and the muddying of the joints were also considered. Insufficient basic scientific data cause the statements to contain some uncertainties. Beyond that, a different classification of sealing types into sealing classes would be desireable for hydrological questions.

Tab. 2: Effectivity Parameter n und Infiltration Factor Fi for Various Surface Sealing Classes

Tab. 2: Effectivity Parameter n und Infiltration Factor Fi for Various Surface Sealing Classes

The calculations provided long-term mean values for total runoff, surface runoff, and percolation for 25,000 individual areas. The values were classified into mm/a and are depicted in this map. Total amounts in m³/a were also calculated and balanced. It must be taken into consideration that the depicted values are mean values for blocks depicted as uniform surfaces; but in reality blocks are not homogeneous structures. Flows of sealed and unsealed surfaces are given here as average values per block. Also, runoff from streets was allocated to the adjacent blocks. It cannot, for example, be seen in the map how much percolation takes place in a square meter of unsealed soil. Special evaluations, both all-area and block-related, had been made in the framework of the Environmental Information System.