The Environmental Atlas maps are available in the new Map Application
Long-term Development of Selected Climate Parameters 2013
Berlin-Grunewald
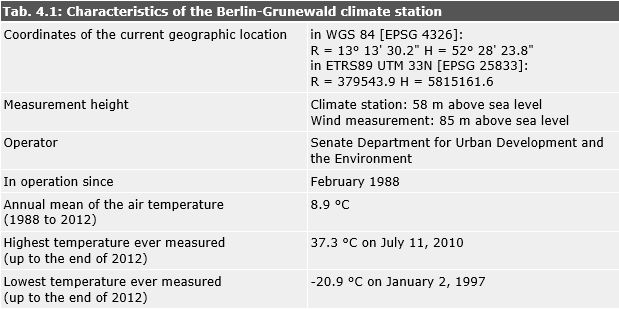
Tab. 4.1: Characteristics of the Berlin-Grunewald climate station
Image: Umweltatlas Berlin
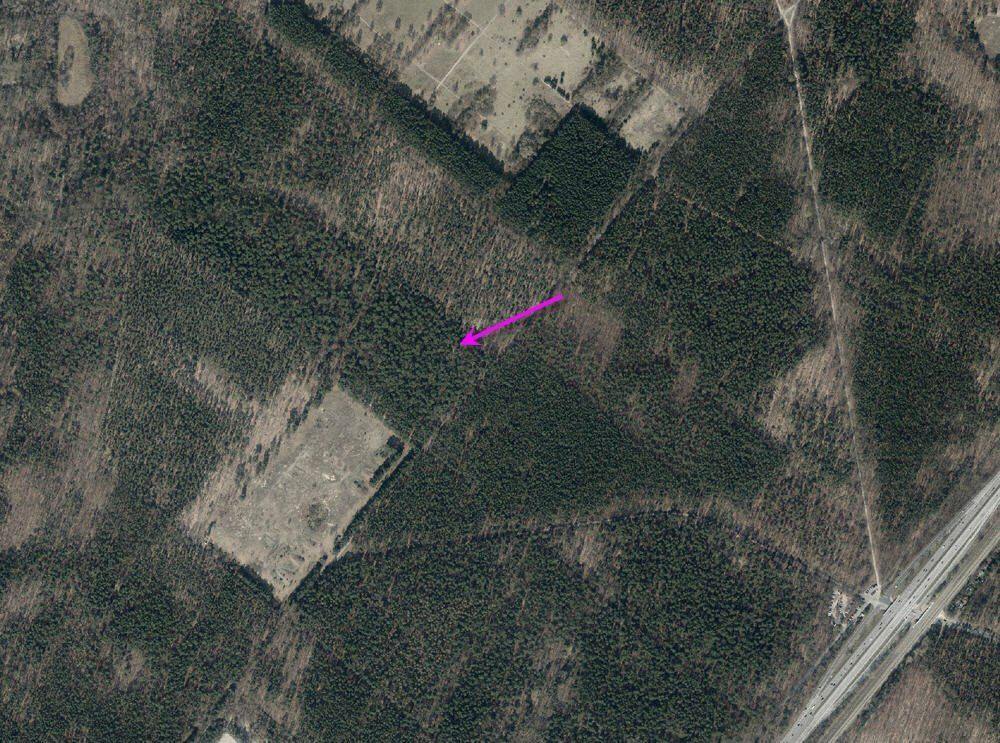
Photo 4.1: Location of the Berlin-Grunewald station (see arrow mark)
Image: SenStadtUm 2014
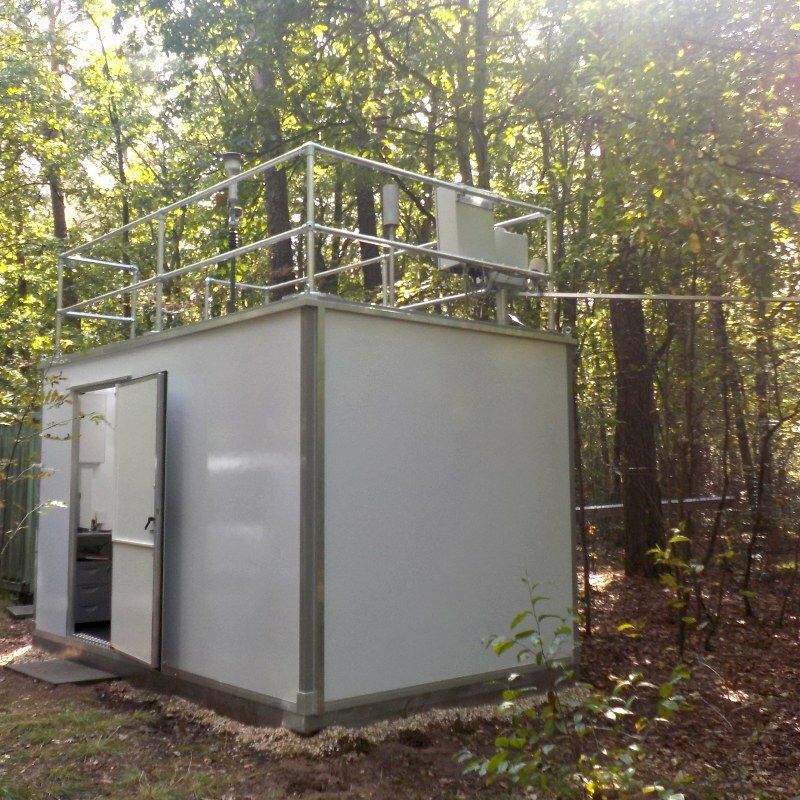
Photo 4.2: View of the BLUME station MC 032 Forst Grunewald Jagen 91
Image: Umweltatlas Berlin
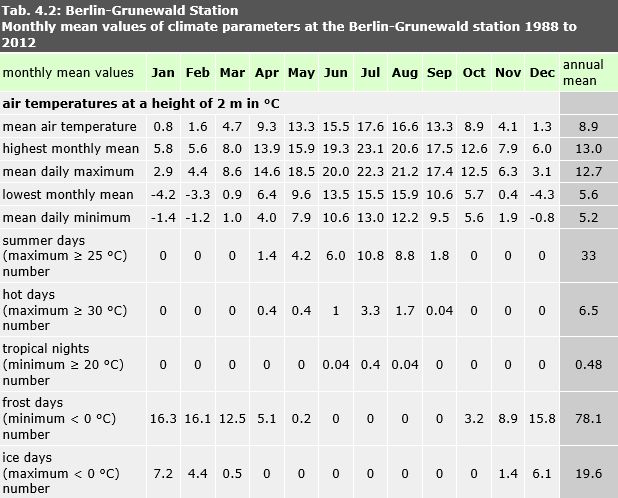
Tab. 4.2: Monthly mean values of climate parameters at the Berlin-Grunewald station (1988 to 2012)
Image: data provided by SenStadtUm 2013, processing GEO-NET 2014
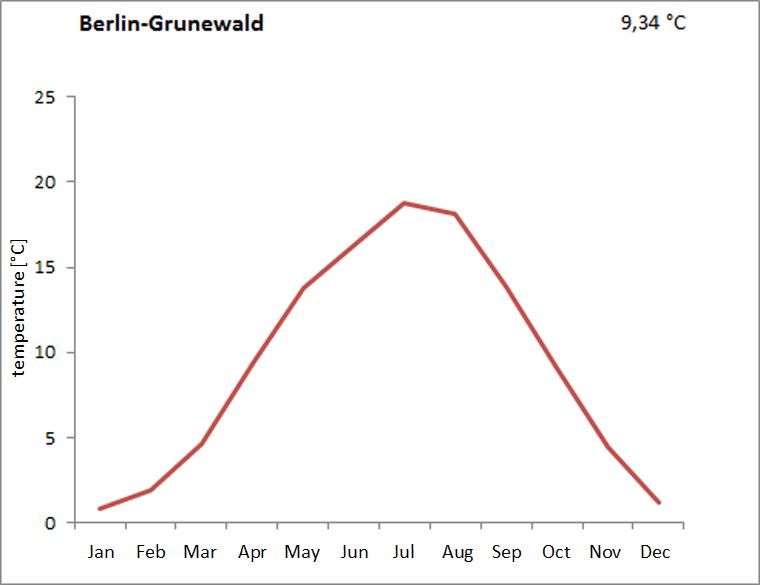
Fig. 4.1: Climate diagram for the Berlin-Grunewald station for the period 1988 to 2010
Image: Knerr 2014
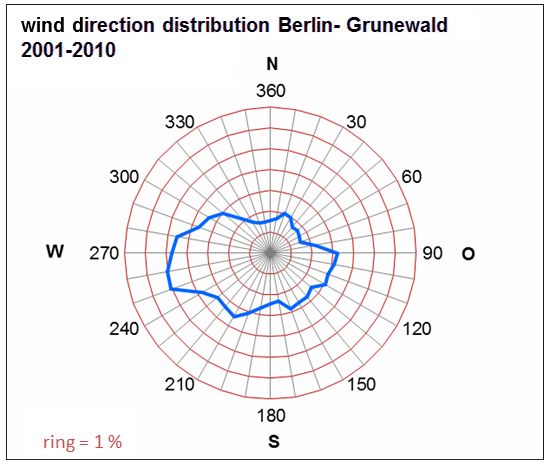
Fig. 4.2: Mean wind direction distribution in the period 2001 to 2010 at the Berlin-Grunewald measurement station (measurement height 27 m, about 7 m above trees 20 m high)
Image: data provided by SenStadtUm 2013, processing GEO-NET 2014
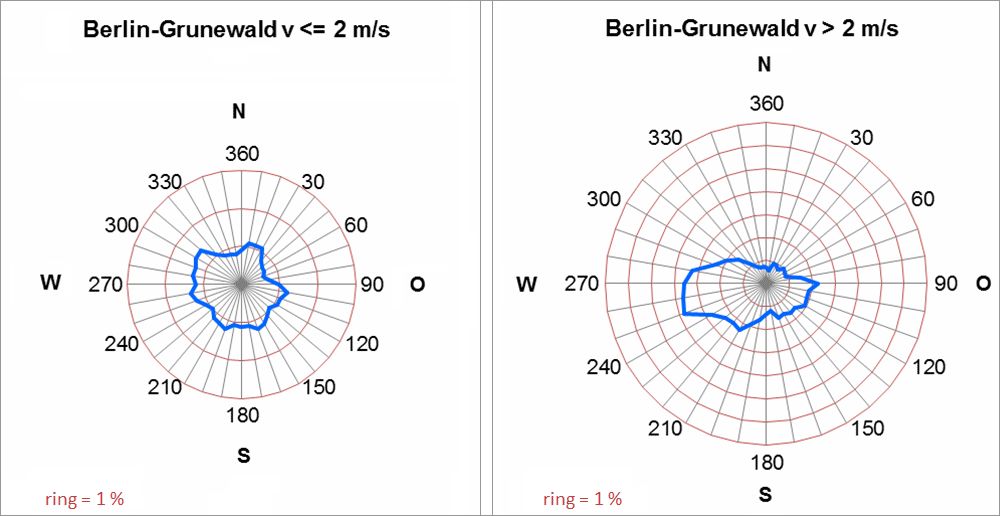
Fig. 4.3: Frequencies of the wind directions in the annual mean in the period 2001 to 2010 at the Berlin-Grunewald measurement station by wind speed
Image: data provided by SenStadtUm 2013, processing GEO-NET 2014
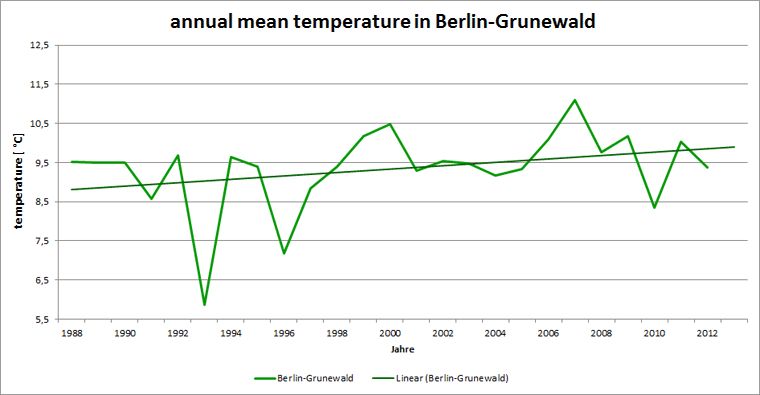
Fig. 4.4: History of the annual mean temperature at the Berlin-Grunewald site in the measurement period 1988 to 2012
Image: GEO-NET 2014, Knerr 2014
Developments, trends
Figure 4.4 shows the history of the annual mean temperature of the years 1988 to 2012. As for all other stations, the trend is increasing over the course of the measurement series. In Berlin-Grunewald, this increase amounts to more than one Kelvin. In 1993, measurements were missed over several weeks between June 4 and September 12.
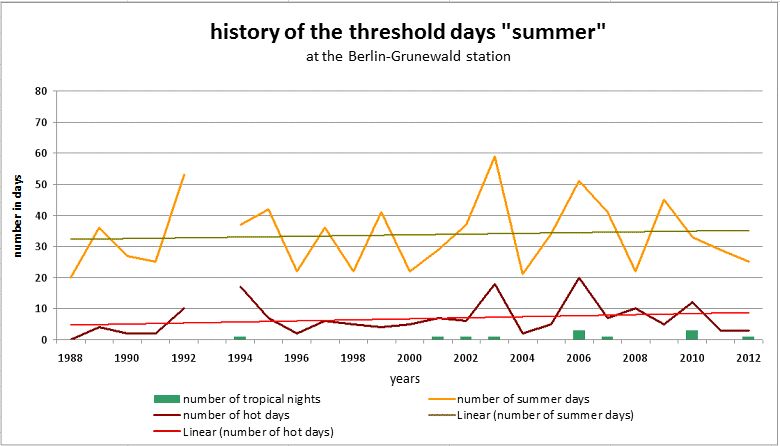
Fig. 4.5: History of the threshold days summer day, hot day and tropical night for the Berlin-Grunewald station in the measurement period 1988 to 2012
Image: GEO-NET 2014, Knerr 2014
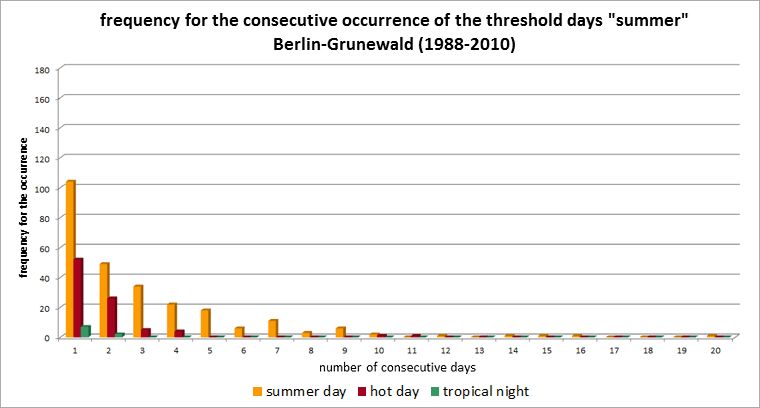
Fig. 4.6: Frequency of occurrence of consecutive summer days, hot days and tropical nights for the 23-year period 1988 to 2010 at the Berlin-Grunewald station
Image: GEO-NET 2014, Knerr 2014
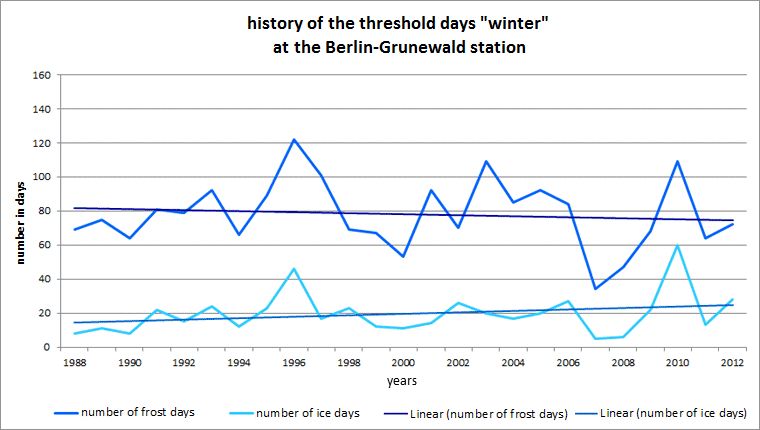
Fig. 4.7: History of the winter threshold days frost day and ice day at the Berlin-Grunewald station in the measurement period 1988 to 2012
Image: GEO-NET 2014, Knerr 2014
Environmental Atlas Contact
Berlin Senate Department for Urban Development, Building and Housing
Mrs. Haag