For the evaluation of the soil functions, the key soil values (cf. Map 01.06) derived from the soil-community map (cf. Map 01.01) and the associated dissertation by Grenzius (1987) were the main source. The quality of these basic data decisively determines the quality and authoritativeness of the evaluation of soil functions. From these and other information, criteria were derived (cf. Map 01.11) to permit an evaluation of the soil functions (cf. Fig. 1). The method of evaluation was developed in the context of the soil protection conception procedure (Lahmeyer 2000), and later transferred to the whole city (Gerstenberg / Smettan 2001, 2005, 2009).The maps presented here are based on updated basic data and improved methods of evaluation (Gerstenberg 2013).
The Environmental Atlas maps are available in the new Map Application
Soil Functions 2010
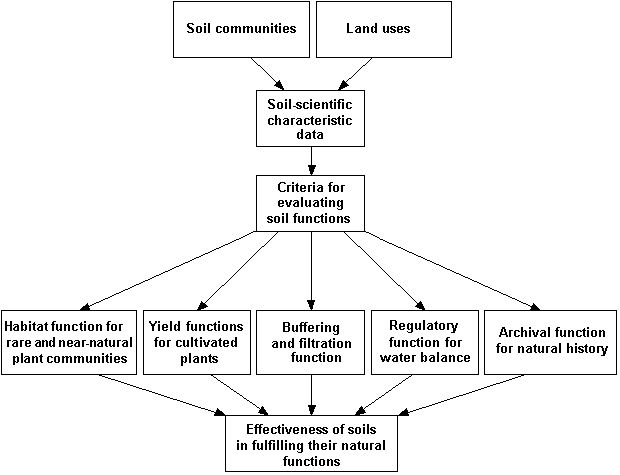
Fig. 1: Diagram for the evaluation of soil functions
Image: Umweltatlas Berlin
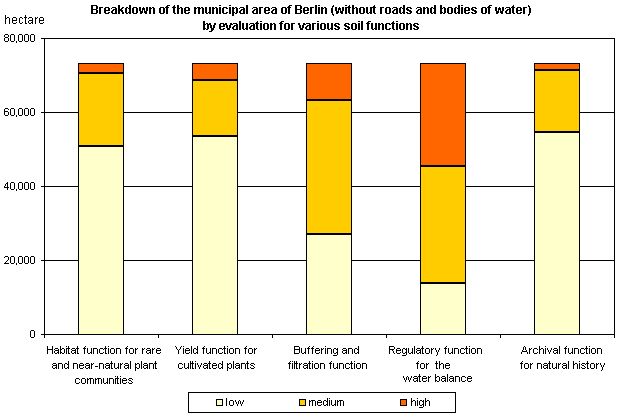
Fig. 2: Breakdown of the municipal area of Berlin (without roads and bodies of water) by evaluation for various soil functions
Image: Umweltatlas Berlin

Fig. 1: Diagram for the evaluation of the habitat function for rare and near-natural plant communities
Image: Umweltatlas Berlin
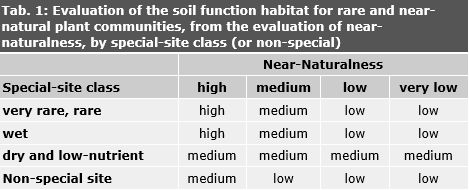
Tab. 1: Evaluation of the soil function habitat for rare and near-natural plant communities, from the evaluation of near-naturalness, by special-site class (or non-special)
Image: Gerstenberg 2013
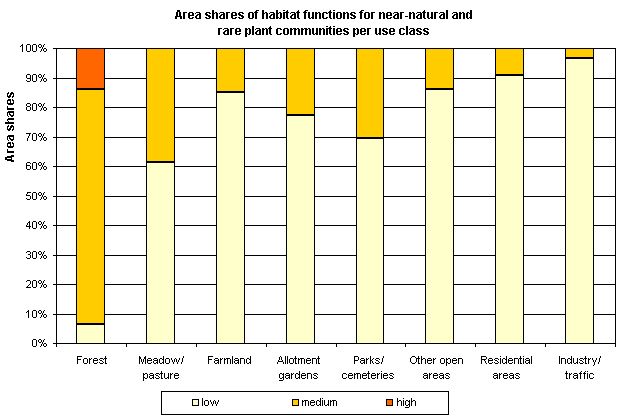
Fig. 2: Area share of the habitat function for rare and near-natural plant communities per use class (incl. impervious sections, without streets and water bodies (not all uses are shown)
Image: Umweltatlas Berlin
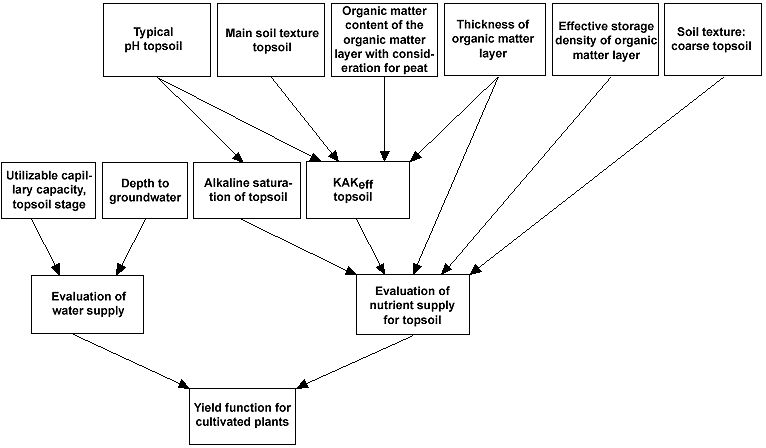
Fig. 1: Diagram for the evaluation of the yield function of cultivated plants
Image: Umweltatlas Berlin
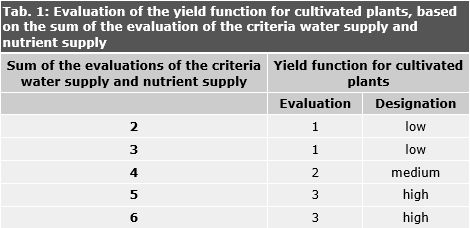
Tab. 1: Evaluation of the yield function for cultivated plants, based on the sum of the evaluation of the criteria water supply and nutrient supply
Image: Gerstenberg 2013
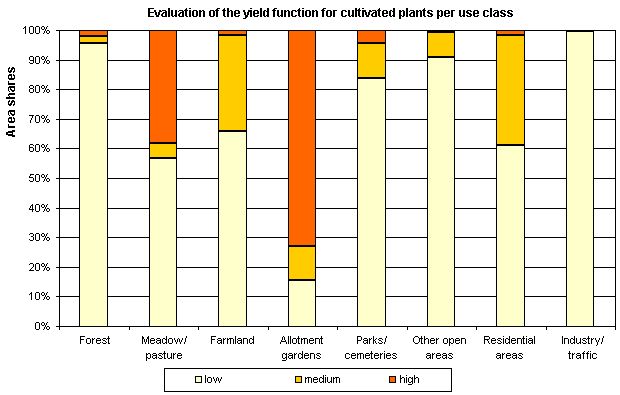
Fig. 2: Evaluation of the yield function for cultivated plants per use class (incl. impervious sections without streets and waters, not all uses, are represented)
Image: Umweltatlas Berlin

Fig. 1: Diagram for the evaluation of the buffering and filtration functions
Image: Umweltatlas Berlin
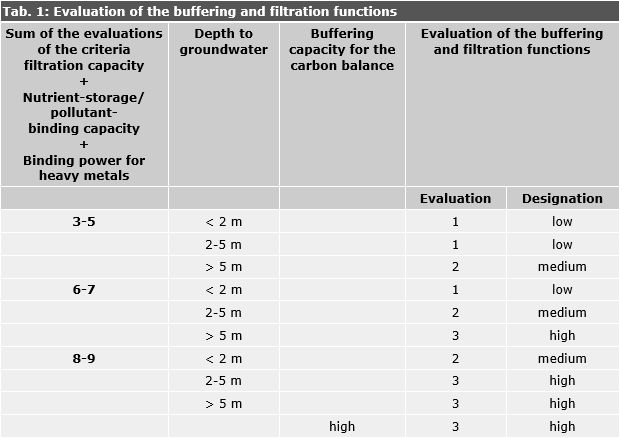
Tab. 1: Evaluation of the buffering and filtration functions
Image: Gerstenberg 2013

Fig. 2: Area share of the buffering and filtration functions per use class (incl. impervious sections without streets and waters, not all uses, are shown)
Image: Umweltatlas Berlin
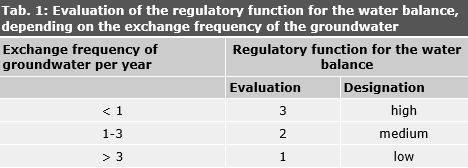
Tab. 1: Evaluation of the regulatory function for the water balance, depending on the exchange frequency of the groundwater
Image: Umweltatlas Berlin
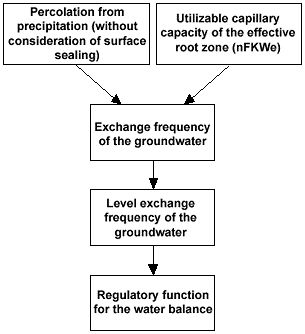
Fig. 1: Diagram for the evaluation of the regulatory function for the water balance
Image: Umweltatlas Berlin
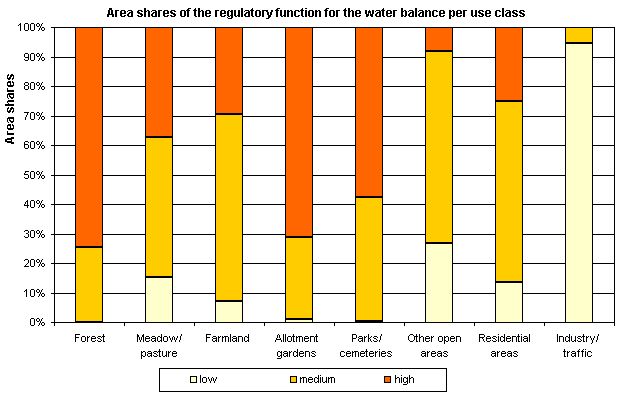
Fig. 2: Area shares of the regulatory function for the water balance per use class (incl. impervious sections without streets and waters, not all uses, are represented)
Image: Umweltatlas Berlin
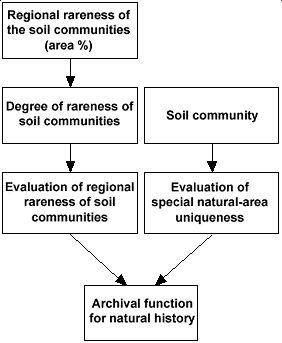
Fig. 1: Diagram for the evaluation of the archival function for natural history
Image: Umweltatlas Berlin
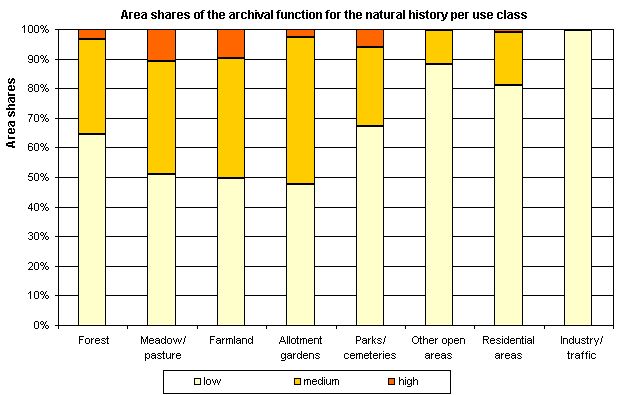
Fig. 2: Area shares of the archival function for the natural history per use class (incl. impervious sections without streets and waters, not all uses, are represented)
Image: Umweltatlas Berlin

Fig. 1: Breakdown of the Berlin area by evaluation for different soil functions (without streets and waters)
Image: Umweltatlas Berlin
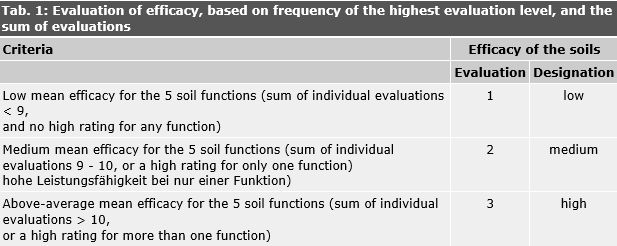
Tab. 1: Evaluation of efficacy, based on frequency of the highest evaluation level, and the sum of evaluations
Image: Umweltatlas Berlin
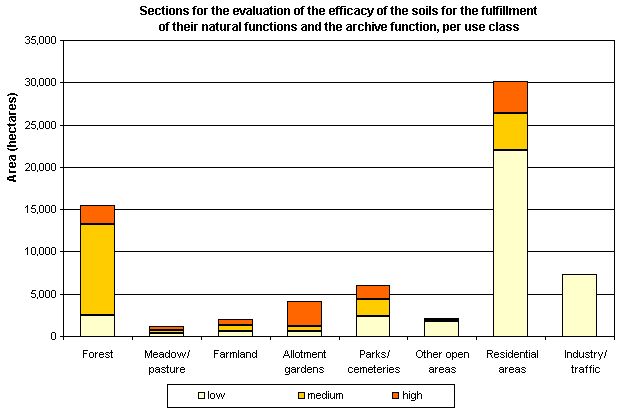
Fig. 2: Sections for the evaluation of the efficacy of the soils for the fulfillment of their natural functions and the archive function, per use class (incl. impervious sections without streets and waters, not all uses, are shown)
Image: Umweltatlas Berlin
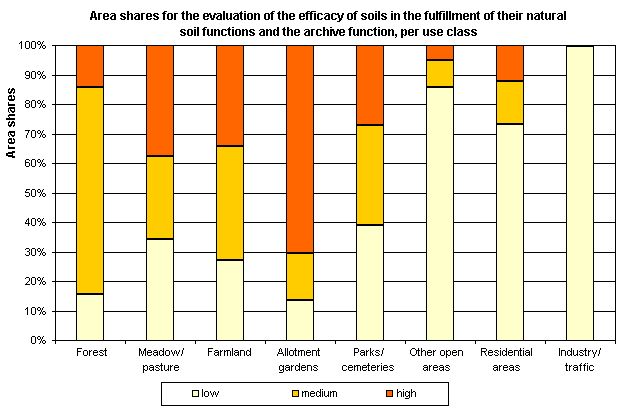
Fig. 3: Area shares for the evaluation of the efficacy of soils in the fulfillment of their natural soil functions and the archive function, per use class (incl. impervious sections without streets and waters, not all uses, are shown)
Image: Umweltatlas Berlin
Environmental Atlas Contact
Berlin Senate Department for Urban Development, Building and Housing
Mrs. Haag