Traffic-related Emissions and Immissions 2015

Methodology

Use of the model

The results of existing street measurements show that the concentration levels set forth in Directive 2008/50/EC and the 39th BImSchV were exceeded at a large number of primary roads – continually, in the case of nitrogen dioxide. Since a measurement-based survey is not possible on all streets of the city, for cost reasons, the pollution immission for the complete primary road network in Berlin was estimated using emission and dispersion calculations. Under this process, those streets are ascertained where the legal limit values are almost certain to be exceeded, or where they will be met.

To achieve this, these measurements are supplemented with model calculations in all traffic-filled streets in which limits are potentially exceeded. However, even in a traffic-filled urban canyon, the background pollution produced by other sources in the city, and introduced by the long distance transportation of pollution, is an important factor. Therefore, to plan the improvement of air quality in Berlin, a system of models is applied that can calculate both the wide-ranging influence of distant sources and the contribution of all emitters in the city, even in traffic-filled urban canyon. For such an estimation of all primary roads (“screening”), the modular program system IMMIS▪▪▪ developed for this purpose is suitable.

IMMIS-Luft▪▪▪ (air) is a screening program system for the evaluation of pollution caused by road traffic. It was developed specifically for application in the context of traffic-related assessments. Provided the necessary input data is known, a rapid calculation of pollution immissions is possible with the aid of this program, both for individual streets and for comprehensive road networks.

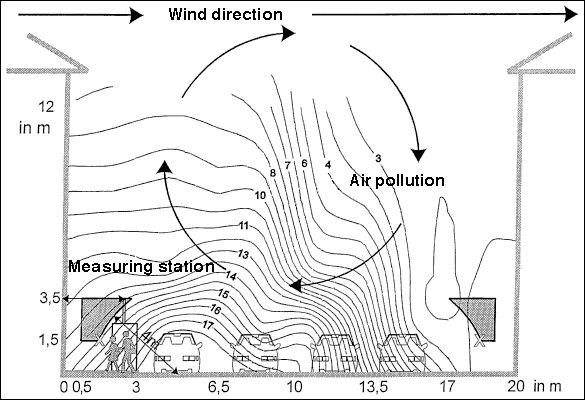
In this process, the pollution immission is calculated on both sides of the street for one point on each side, at an elevation of 1.5 m, and at a distance of 0.5 m from the edge of the building (cf. Figure 1). The mean of the calculated immission at these two points is considered the characteristic estimate of the immission pollution in this section.

Fig. 1: Pollution distribution on an urban canyon, with the measurement range as per 39th BImSchV, and the receptors used for calculation with the IMMIS urban canyon model

Fig. 1: Pollution distribution on an urban canyon, with the measurement range as per 39th BImSchV, and the receptors used for calculation with the IMMIS▪▪▪ urban canyon model

Traffic-caused air pollution immission in urban canyons is modelled with the programme segment IMMIScpb. It enables the calculation of hourly values of pollutant immissions produced by local traffic at any receptor in an urban canyon with varying building heights and with spaces between buildings which allow the passage of wind, on the basis of easily accessible meteorological quantities. An additional required input quantity is the emission level for each section of the street. The emissions were calculated from the current traffic data using the programme segment IMMISem. The pollution produced by the city is derived from the sum of the additional pollution measured using the urban canyon model, the local street traffic, and the urban background pollution calculated using the IMMISnet program.

Update of the calculational basis for applying the model to the reference year 2015

Information on the actual motor vehicle fleet composition in Berlin was available from license-plate observations for the reference year 2015. In addition, information on the current and future fleet composition of the regular buses of the BVG was available.

The traffic volumes on Berlin’s primary roads were taken from the calculations for 2015 for the update of the 2011-2017 Air Quality Plan (cf. Environmental Atlas Map Traffic Volumes, 07.01, Edition 2017).

Moreover, the background pollution values in the urban background were adapted for the recalculation. For this, the newest emissions surveys were used for the reference year 2015 (cf. Environmental Atlas Map Long-Term Development of Air Quality, 03.12, Edition 2018).

The calculation of the motor vehicle emissions was carried out with the new emission factors based on the current UBA manual (Version 3.3).

Evaluation of the calculation results based on an index

The map drafted using this process shows the spatial distribution of traffic caused air pollution for NO2 and particulate matters (PM10 and PM2.5). A summary assessment was conducted for NO2 and PM10. The index developed weighs the calculated concentrations of both pollutants according to their limit values throughout the network of road sections of the primary roads network for 2015, which has been expanded to some 12,000 for this purpose, and adds the quotients. For example, if the two components both reach 50 % of the limit, an index of 1.00 will result. All sections that show a reading in excess of 1.8 (90 % or more of the limit value) will require special attention in future.

Data display for the map Traffic-related Air Pollution

The data display in the Geoportal FIS Broker includes the following detailed information on the selected road section:

  • Section Number
  • Name of the road section
  • Length of the road section [m]
  • Average daily traffic volume (DTV) motor vehicles, reference year 2015
  • NO2 pollution (annual mean in µg/m3), reference year 2015
  • PM10 pollution (annual mean in µg/m3), reference year 2015
  • PM2.5 pollution (annual mean in µg/m3), reference year 2015
  • Air pollution index for NO2, reference year 2015
  • Air pollution index for PM10, reference year 2015
  • Overall air pollution index for NO2 and PM10, reference year 2015