Long-term Development of Selected Climate Parameters 2013

Results of the station evaluations

The main measurement data at the stations under consideration are first considered in combination in order to analyse differences and common features of the measurement sites. The focus of the considerations is on the period from 1981 to 2010, as climate data are available for most of the stations under consideration in this period and these 30 years are regarded as a current period for considering "long-term climate conditions".

The individual data are provided in relation to the figures in a combined table for all stations (with reference to the summer and winter characteristic quantities) as well as individual station tables (including all daily values since records began). However, they are also available for download in a combined archive (zip; 110 MB).

Comparison of the measurement series of the Berlin stations Tempelhof, Tegel, Dahlem, Alexanderplatz and Grunewald as well as the Potsdam station

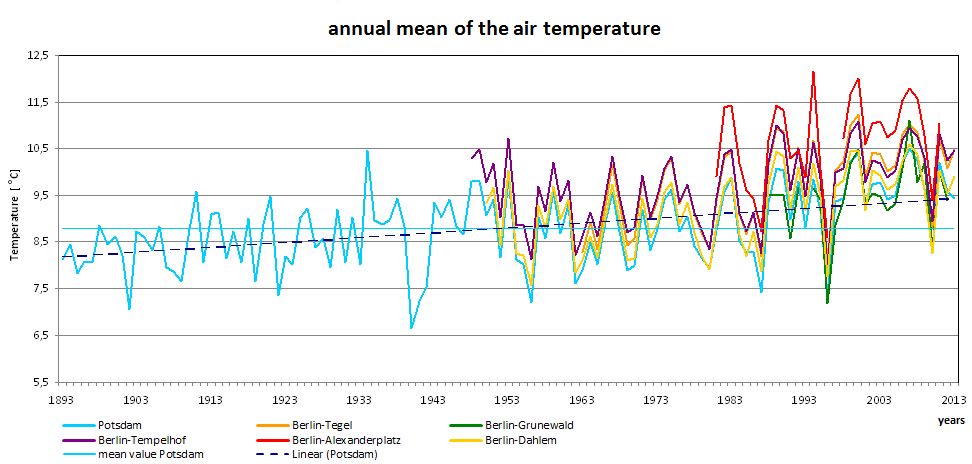
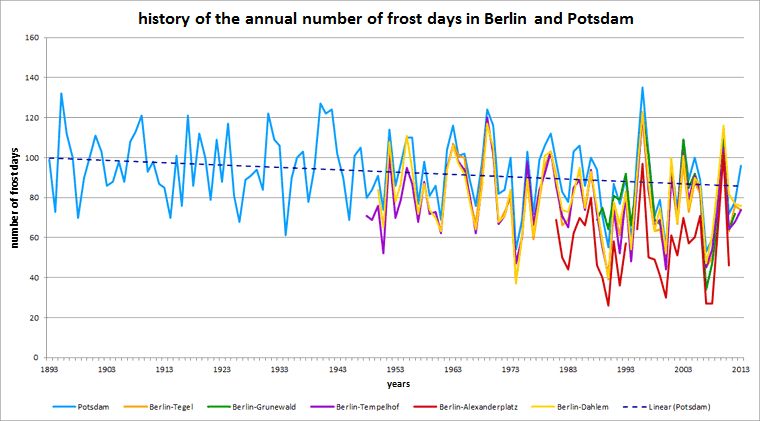
The history of the air temperature of all five Berlin measurement stations as well as the Potsdam station is illustrated in Figure 1.1. The data for the stations Berlin-Alexanderplatz and Berlin-Grunewald were available only up to the end of 2012, for all other measurement sites up to the end of 2013.

Measurements going back to 1893 are available for the Potsdam measurement station; hence a trend line (dashed in dark blue) and a mean value across all measurement years (light blue) are additionally shown for this station. These clearly indicate the rise in air temperature within the period under consideration. The trend line shows a warming of more than 1 K between 1893 and 2013. While the temperature values of the Potsdam station were significantly below the mean value when records began, they are consistently above the mean value line for the last 20 years. It can also be seen that the Alexanderplatz station consistently exhibits the highest values in comparison to the other stations. The Berlin-Tempelhof station with its inner-city peripheral location also shows higher temperature values than the stations in peripheral locations or in the surroundings.

Fig. 1.1: History of the annual mean temperatures at a height of 2 m of all stations under consideration in the respective measurement period up to the end of 2013; Berlin-Alexanderplatz and Berlin-Grunewald stations up to the end of 2012

Fig. 1.1: History of the annual mean temperatures at a height of 2 m of all stations under consideration in the respective measurement period up to the end of 2013; Berlin-Alexanderplatz and Berlin-Grunewald stations up to the end of 2012

Figure 1.2 shows the history of the summer days in the Berlin area. A summer day is a day on which the maximum air temperature is at least 25 °C (Tmax ≥ 25 °C). Here, too, a trend line for the Potsdam measurement station was added. It shows an increase in the number of summer days by about 15 days in the period from 1893 to 2013. Note the year 1947, in which 71 days were recorded in Potsdam on which the air temperature reached a value of 25 °C or more. This value is even higher than the one for the "hundred-year summer" in 2003. The Berlin-Grunewald station consistently records the fewest summer days due to its peripheral forest location.

Fig. 1.2: History of the number of summer days of all stations under consideration in the respective measurement period up to the end of 2013; Berlin-Alexanderplatz and Berlin-Grunewald stations up to end of 2012

Fig. 1.2: History of the number of summer days of all stations under consideration in the respective measurement period up to the end of 2013; Berlin-Alexanderplatz and Berlin-Grunewald stations up to end of 2012

The history of the hot days is similar to that of the summer days. On a hot day, the maximum air temperature is 30 °C or above (Tmax ≥ 30 °C). In this investigation, hot days are simultaneously also counted as summer days. In years with particularly many summer days, the number of hot days recorded is usually also above average (Fig. 1.3). Here, too, the year 1947 stands out, in which 26 hot days were recorded at the Potsdam station. But many hot days were also recorded in the years 2003 and 2006, with the year 2006 featuring prominently also with respect to the tropical nights (Tmin ≥ 20 °C) (cf. Fig. 1.4).

In comparison to the summer days, the two years 2003 and 2006 stand out more prominently in the history of the hot days. At the Berlin-Alexanderplatz station, at which the temperature is inherently higher than at the other stations under consideration due to its inner-city location, 18 hot days were recorded in 2003, compared with 25 corresponding days in 2006.

Fig. 1.3: History of the number of hot days of all stations under consideration in the respective measurement period up to the end of 2013; Berlin-Alexanderplatz and Berlin-Grunewald stations up to the end of 2012

Fig. 1.3: History of the number of hot days of all stations under consideration in the respective measurement period up to the end of 2013; Berlin-Alexanderplatz and Berlin-Grunewald stations up to the end of 2012

The history of the tropical nights in the region also clearly shows the influence of urban structures on the air temperature (Fig. 1.4). The Berlin-Alexanderplatz station consistently shows — apart from years with missed measurements (1993/94) — the highest number of tropical nights. The thermal effects of the nocturnal energy flows from the surrounding building structures have a particular effect here. A high proportion of impervious cover and the dense roadside development with its large heat storage capacity form a comprehensive reservoir for sustained heat radiation in summer nights. According to the German Meteorological Service, the Berlin-Alexanderplatz station is in first place out of all German climate stations with an average of 5 tropical nights per year. However, in years with pronounced summers the number of tropical nights can lie far above the average value, as the number of 21 corresponding nights in 2006 shows.

Fig. 1.4: History of the number of tropical nights of all stations under consideration in the period 1981 to 2013; Berlin-Alexanderplatz and Berlin-Grunewald stations up to the end of 2012

Fig. 1.4: History of the number of tropical nights of all stations under consideration in the period 1981 to 2013; Berlin-Alexanderplatz and Berlin-Grunewald stations up to the end of 2012

The history of the frost days (minimum temperature under 0 °C) (cf. Fig. 1.5) shows a downward trend on the basis of the Potsdam station, which correlates well with the upward trend of the summerly threshold days (Figure 1.1 to 1.4). A decrease in the number of frost days by close to 15 days over the entire period can be observed. The Berlin-Alexanderplatz station registered the fewest frost days per year over the entire history.

Fig. 1.5: History of the number of frost days of all stations under consideration in the respective measurement period up to the end of 2013; Berlin-Alexanderplatz and Berlin-Grunewald stations up to the end of 2012

Fig. 1.5: History of the number of frost days of all stations under consideration in the respective measurement period up to the end of 2013; Berlin-Alexanderplatz and Berlin-Grunewald stations up to the end of 2012

The history of the ice days (maximum temperature under 0 °C) at the measurement stations in the Berlin area also shows a decrease. With about five days for the trend line of the Potsdam station, this is much less pronounced than in the case of the frost days. In analogy with the analysis of the hot days, the frost days are also being counted as ice days here.

Here, too, the Berlin-Alexanderplatz measurement station plays a special role in the collective of stations due to its inner-city location: As in the case of the frost days, it exhibits the fewest ice days. All other stations show a similar history.

Fig. 1.6: History of the number of ice days of all stations under consideration in the respective measurement period up to the end of 2013; Berlin-Alexanderplatz and Berlin-Grunewald stations up to the end of 2012

Fig. 1.6: History of the number of ice days of all stations under consideration in the respective measurement period up to the end of 2013; Berlin-Alexanderplatz and Berlin-Grunewald stations up to the end of 2012

In the following, the evaluation of selected climate parameters at the individual stations is represented using tables and graphs. The current long-term time interval of the 30 years from 1981 to 2010 was selected as a reference period, as far as data were available. The evaluations of the mean wind direction distributions refer to the 10-year time interval from 2001 to 2010. Hourly values of wind direction and wind speeds were available for the Berlin measurement stations Tegel, Tempelhof, Dahlem and Grunewald.

Berlin-Alexanderplatz

Site

Tab. 2.1: Characteristics of the Berlin-Alexanderplatz climate station

Tab. 2.1: Characteristics of the Berlin-Alexanderplatz climate station

Photo 2.1: Location of the Berlin-Alexanderplatz station (see arrow mark)

Photo 2.1: Location of the Berlin-Alexanderplatz station (see arrow mark)

Photo 2.2: View of the Berlin-Alexanderplatz station

Photo 2.2: View of the Berlin-Alexanderplatz station

The Berlin-Alexanderplatz station lies directly in the city centre of Berlin at the corner of Karl-Liebknecht-Straße and Spandauer Straße (cf. Photo 2.2). The river Spree flows about 350 m west of the current site of the station. The surroundings of the station are characterised by dense and partly high buildings and only very few, mostly smaller green spaces. Due to the inner-city structure at the measurement site, this station exhibits by far the highest nocturnal air temperatures among the Berlin stations and is treated nationwide as a representative inner-city climate station by the German Meteorological Service (DWD). Unfortunately, some measurements were missed in the past, some because of replannings at and near the old measurement site at the foot of the television tower (cf. Berliner Morgenpost on August 6, 2011). The fixed station has existed at the site described above near St. Mary’s Church and the Neptune Fountain since 2012.

The station values used for the investigation start on January 1, 1981, and exhibit some interruptions (mainly in the years 1993, 1994 and 1997) that partly affected the calculation of the annual values, in particular the annual mean values (see the original values within the Excel tables).

The temperature history of the Berlin-Alexanderplatz station is shown in Figure 2.1 for the years 1981 up to July 2011. The gap caused by the missed measurements in the 1990s is clearly visible. As mentioned, the measurement series is regarded nationwide as representative of an inner-city temperature history. With an average value of 10.66 °C, it shows by far the highest value of the six stations being compared here. The annual average value was 9.90 °C at the start of the temperature records being evaluated, in 1981, and increased to 11.04 °C in 2012.

Developments, trends

Fig. 2.1: History of the annual mean temperature at the Berlin-Alexanderplatz site in the long-term time interval 1981 to 2010

Fig. 2.1: History of the annual mean temperature at the Berlin-Alexanderplatz site in the long-term time interval 1981 to 2010

The climate diagram for the Berlin-Alexanderplatz station is shown in Figure 2.2. The maximum of the annual total precipitation lies in the summer months; by contrast, the lowest amounts of precipitation occur in the transitional seasons.

Fig. 2.2: Climate diagram for the Berlin-Alexanderplatz station for the long-term time interval 1981 to 2010

Fig. 2.2: Climate diagram for the Berlin-Alexanderplatz station for the long-term time interval 1981 to 2010

The very high number of tropical nights is notable in Figure 2.3, given that tropical nights are very rare in Germany so far. At most DWD stations there is less than one tropical night per year on average (DWD, accessed on March 15, 2016).

Here the exceptional inner-city location of the station compared to the vast majority of other official climate stations has a marked effect. The trend of the summer days and hot days also shows the special situation of this station (cf. also Fig. 1.2 and 1.3).

Note the period from July 18 to July 28, 2006, during which temperature values above 30 °C were measured every day, as well as the period from July 19 to July 29, 2006, during which the criteria of a tropical night with temperature values of 20 °C and higher were fulfilled every night (cf. Fig. 2.4).

Fig. 2.3: History of the threshold days summer day, hot day and tropical night for the Berlin-Alexanderplatz station for the long-term period 1981 to 2010

Fig. 2.3: History of the threshold days summer day, hot day and tropical night for the Berlin-Alexanderplatz station for the long-term period 1981 to 2010

Fig. 2.4: Frequency of the occurrence of consecutive summer days, hot days and tropical nights for the long-term period 1981 to 2010 at the Berlin-Alexanderplatz station

Fig. 2.4: Frequency of the occurrence of consecutive summer days, hot days and tropical nights for the long-term period 1981 to 2010 at the Berlin-Alexanderplatz station

Due to the higher temperatures in the inner city of Berlin, the number of frost days and ice days is significantly lower than at other measurement sites. However, a trend towards a decrease in the number of these threshold days cannot be ascertained. The number of frost days remained nearly constant at the Berlin-Alexanderplatz measurement station over the last 30 years. The number of days with a maximum temperature of at most 0 °C decreased by only one day in this period (cf. Fig. 2.5).

Fig. 2.5: History of the threshold days frost day and ice day at the Berlin-Alexanderplatz station for the long-term period 1981 to 2010

Fig. 2.5: History of the threshold days frost day and ice day at the Berlin-Alexanderplatz station for the long-term period 1981 to 2010

Berlin-Dahlem

Site

Tab. 3.1: Characteristics of the Berlin-Dahlem climate station

Tab. 3.1: Characteristics of the Berlin-Dahlem climate station

Photo 3.1: Location of the Berlin-Dahlem station (see arrow mark)

Photo 3.1: Location of the Berlin-Dahlem station (see arrow mark)

The Dahlem climate station has long been regarded as the Berlin reference station both for long-term observation and for current weather reporting. The station’s location changed several times — albeit within narrow confines — under the influence of the establishment and the initially varying locations of the Institute of Meteorology of the FU Berlin founded in 1948. Due to its significance for Berlin climate observation, its various sites since 1908 are documented in photographs below.

Photo 3.2: Site of the Dahlem climate station on the grounds of the Royal Gardening Academy (Königliche Gärtnerlehranstalt) at Königin-Luise-Str. 22 (period from April 1, 1908 to 1962)

Photo 3.2: Site of the Dahlem climate station on the grounds of the Royal Gardening Academy (Königliche Gärtnerlehranstalt) at Königin-Luise-Str. 22 (period from April 1, 1908 to 1962)

Photo 3.3: Site of the Dahlem climate station on the grounds of the first site of the Institute of Meteorology of the FU Berlin at Kibitzweg 20 (period from December 1 (uncertain) 1949 to October 2, 1951)

Photo 3.3: Site of the Dahlem climate station on the grounds of the first site of the Institute of Meteorology of the FU Berlin at Kibitzweg 20 (period from December 1 (uncertain) 1949 to October 2, 1951)

Photo 3.4: Site of the Dahlem climate station on the grounds of the second site of the Institute of Meteorology of the FU Berlin at Podbielskiallee 62 (period from October 3, 1951 to July 11, 1997)

Photo 3.4: Site of the Dahlem climate station on the grounds of the second site of the Institute of Meteorology of the FU Berlin at Podbielskiallee 62 (period from October 3, 1951 to July 11, 1997)

Photo 3.5: Current site of the Dahlem climate station on the grounds of the Berlin Botanical Garden at Königin-Luise-Str. 6-8 (period since July 12, 1997)

Photo 3.5: Current site of the Dahlem climate station on the grounds of the Berlin Botanical Garden at Königin-Luise-Str. 6-8 (period since July 12, 1997)

The measurement station of the Free University of Berlin is located about 13 km southwest of the city centre of Berlin in the Dahlem district of the borough Steglitz-Zehlendorf on the grounds of the Botanical Garden encompassing more than 43 ha (cf. Photo 3.1). The surroundings are characterised by mansions with spacious gardens and some smaller parks. To the west, the Dahlem district borders on the Berlin forest of Grunewald. The wind measurement station is located around 750 m to the northeast on the building of an FU institute on the Fichtenberg (Carl-Heinrich-Becker-Weg 10).

Long-term mean values

Table 3.2 gives an overview of the long-term monthly mean values of selected climate parameters at the Dahlem station in the 30-year period 1981 to 2010 under consideration.

Tab. 3.2: Monthly mean values of climate parameters at the Berlin-Dahlem station for the long-term period 1981 to 2010

Tab. 3.2: Monthly mean values of climate parameters at the Berlin-Dahlem station for the long-term period 1981 to 2010

The climate diagram of the Berlin-Dahlem station is shown in Figure 3.1. It shows the averaged history of temperature and precipitation over the individual months over the 30-year period 1981 to 2010. August is the month with the most rainfall; the least precipitation occurs in the transitional seasons.

The sunshine diagram follows the temperature curve, as expected (cf. Fig. 3.2).

Fig. 3.1: Climate diagram of the Berlin-Dahlem station for the long-term period 1981 to 2010

Fig. 3.1: Climate diagram of the Berlin-Dahlem station for the long-term period 1981 to 2010

Fig. 3.2: Mean monthly sunshine duration at the Berlin-Dahlem station for the long-term period 1981 to 2010

Fig. 3.2: Mean monthly sunshine duration at the Berlin-Dahlem station for the long-term period 1981 to 2010

The following figures show wind direction distributions at the Berlin-Dahlem measurement station in the period from 2001 to 2010. In addition to the mean long-term wind direction distribution, distributions for low-wind conditions with speeds up to 2 m/s as well as conditions with wind speeds above 2 m/s were evaluated. The wind recordings occur at a height of 26 m (cf. Tab. 3.1). At this measurement height, low-wind conditions only occurred in 8.5 % of the cases in the period under consideration. Calms (windless conditions) were observed in 0.1 % of the situations. Wind speeds above 2 m/s occurred in 91.5 % of the evaluated period. The red ring lines in the diagrams indicate the mean frequencies of occurrence of the wind direction in the respective period under consideration in percent. The distance between ring lines corresponds to 1 %.

Fig. 3.3: Mean wind direction distribution in the period 2001 to 2010 at the Berlin-Dahlem measurement station (measurement height 26 m). The ring lines indicate the frequencies of occurrence of the wind directions, their distance corresponds to 1 %

Fig. 3.3: Mean wind direction distribution in the period 2001 to 2010 at the Berlin-Dahlem measurement station (measurement height 26 m). The ring lines indicate the frequencies of occurrence of the wind directions, their distance corresponds to 1 %

Fig. 3.4: Frequencies of the wind directions in the annual mean at the Berlin-Dahlem measurement station in the period 2001 to 2010 by wind speed

Fig. 3.4: Frequencies of the wind directions in the annual mean at the Berlin-Dahlem measurement station in the period 2001 to 2010 by wind speed

Developments, trends

Figure 3.5 shows the history of the annual mean temperature of the years 1950 to 2013. The trend is increasing over the course of the measurement series, as for all other stations. In Berlin-Dahlem, this increase amounts to more than one Kelvin. A period of significantly lower temperatures between the mid-1950s until around 1970 can be discerned.

Fig. 3.5: History of the annual mean temperature at the Berlin-Dahlem station in the period 1950 to 2013

Fig. 3.5: History of the annual mean temperature at the Berlin-Dahlem station in the period 1950 to 2013

Figure 3.6 shows the history of the threshold days occurring in summer during the entire observation period 1950 to 2013. A positive trend can be observed both for the summer days and for the hot days. The number of summer days per year increased by around 16 days, the number of hot days by about five. No trend can be discerned for the tropical nights. This number is very low in comparison to the other measurement stations. The location of the station in surroundings with a high proportion of green spaces plays a significant role in this regard. Whereas buildings and sealed surfaces store much heat energy upon high solar irradiation during the day, which they release at night, this occurs to a significantly lower extent in the case of areas characterised by vegetation.

Fig. 3.6: History of the threshold days summer day, hot day and tropical night at the Berlin-Dahlem station in the period 1950 to 2013

Fig. 3.6: History of the threshold days summer day, hot day and tropical night at the Berlin-Dahlem station in the period 1950 to 2013

In considering the frequency, it is to be noted that the number of summer days occurring with a frequency of a duration of only one day is the lowest at the Berlin-Dahlem measurement station among all measurement sites. The location on the very open site on a meadow in the Botanical Garden may contribute to this. On the other hand, longer periods with maximum temperatures of 25 °C and above occur less frequently in Berlin-Dahlem than at other stations. The longest time span of 26 consecutive days is also shorter by five days than at the remaining stations. Tropical nights occurred on two consecutive days only in one case (July 27 and 28, 2013) (cf. Fig. 3.7).

Fig. 3.7: Frequency of occurrence of consecutive summer days, hot days and tropical nights for the long-term period 1981 to 2010 at the Berlin-Dahlem station

Fig. 3.7: Frequency of occurrence of consecutive summer days, hot days and tropical nights for the long-term period 1981 to 2010 at the Berlin-Dahlem station

The decrease in the number of frost days and ice days occurring (cf. Fig. 3.8) is probably also a contributing effect of global warming. The number of frost days decreased by around eight days on average in the period 1950 to 2013, the number of ice days by around five days.

Fig. 3.8: History of the threshold days frost day and ice day at the Berlin-Dahlem station in the period 1950 to 2013

Fig. 3.8: History of the threshold days frost day and ice day at the Berlin-Dahlem station in the period 1950 to 2013

Berlin-Grunewald

Site

Tab. 4.1: Characteristics of the Berlin-Grunewald climate station

Tab. 4.1: Characteristics of the Berlin-Grunewald climate station

Photo 4.1: Location of the Berlin-Grunewald station (see arrow mark)

Photo 4.1: Location of the Berlin-Grunewald station (see arrow mark)

Photo 4.2: View of the BLUME station MC 032 Forst Grunewald Jagen 91

Photo 4.2: View of the BLUME station MC 032 Forst Grunewald Jagen 91

The Grunewald measurement station is an exceptional case among the Berlin stations being evaluated here. The station of the Berlin Air Quality Monitoring Network BLUME is located within a stand of sparse pine trees of about 20 m height in the Grunewald forest. The air temperature and humidity are recorded at heights of 2 and 18 m, respectively; the wind measurements occur at a height of 27 m above ground and thus about 7 m above the level of the tree tops. The measurements of the meteorological parameters thus reflect the local climate of the adjoining forest. Due to the location, the long-term annual mean of the air temperature takes the lowest values among the Berlin stations under consideration. In contrast to the other evaluations, the monthly mean values given refer to the 25-year period from 1988 to 2012.

Long-term mean values

Table 4.2 gives an overview of the long-term monthly mean values of selected climate parameters at the Grunewald station in the 25-year period 1988-2012 under consideration.

Tab. 4.2: Monthly mean values of climate parameters at the Berlin-Grunewald station (1988 to 2012)

Tab. 4.2: Monthly mean values of climate parameters at the Berlin-Grunewald station (1988 to 2012)

At the Berlin-Grunewald station, too, the measurements from 1988 to 2010 were taken into account for the climate diagram. One precipitation measurement series is missing for the Berlin-Grunewald station (cf. Tab. 4.2) because primarily aerosols are measured within the Berlin Air Quality Monitoring Network and only a few meteorological parameters are recorded in addition.

Fig. 4.1: Climate diagram for the Berlin-Grunewald station for the period 1988 to 2010

Fig. 4.1: Climate diagram for the Berlin-Grunewald station for the period 1988 to 2010

The following figures show wind direction distributions at the Berlin-Grunewald measurement station in the period from 2001 to 2010. In addition to the mean long-term wind direction distribution, distributions for low-wind conditions with speeds up to 2 m/s as well as conditions with wind speeds above 2 m/s were evaluated. At this measurement height, low-wind conditions occurred in 38.1 % of the cases in the period under consideration. Wind speeds above 2 m/s occurred 61.9 % of the time. Due to the measurements at a height of only about 7 metres above the trees with a height of 20 m, the lowest wind speeds were recorded here among the stations evaluated. The red ring lines in the diagrams indicate the mean frequencies of occurrence of the wind direction in the respective period under consideration in percent. The distance between ring lines corresponds to 1 %.

Fig. 4.2: Mean wind direction distribution in the period 2001 to 2010 at the Berlin-Grunewald measurement station (measurement height 27 m, about 7 m above trees 20 m high)

Fig. 4.2: Mean wind direction distribution in the period 2001 to 2010 at the Berlin-Grunewald measurement station (measurement height 27 m, about 7 m above trees 20 m high)

Fig. 4.3: Frequencies of the wind directions in the annual mean in the period 2001 to 2010 at the Berlin-Grunewald measurement station by wind speed

Fig. 4.3: Frequencies of the wind directions in the annual mean in the period 2001 to 2010 at the Berlin-Grunewald measurement station by wind speed

Fig. 4.4: History of the annual mean temperature at the Berlin-Grunewald site in the measurement period 1988 to 2012

Fig. 4.4: History of the annual mean temperature at the Berlin-Grunewald site in the measurement period 1988 to 2012

Developments, trends

Figure 4.4 shows the history of the annual mean temperature of the years 1988 to 2012. As for all other stations, the trend is increasing over the course of the measurement series. In Berlin-Grunewald, this increase amounts to more than one Kelvin. In 1993, measurements were missed over several weeks between June 4 and September 12.

The number of summer days and hot days is also increasing at the Berlin-Grunewald station. With a plus of about seven summer days and four hot days, the increase is not quite as marked as at the other stations evaluated (cf. Fig. 4.5). Here, too, it has to be taken into consideration that several weeks of measurements were missed in 1993 between June 4 and September 12.

Fig. 4.5: History of the threshold days summer day, hot day and tropical night for the Berlin-Grunewald station in the measurement period 1988 to 2012

Fig. 4.5: History of the threshold days summer day, hot day and tropical night for the Berlin-Grunewald station in the measurement period 1988 to 2012

For the years with a strongly positively deviating number of threshold days, on the one hand the year 2003 is notable, in which very warm conditions prevailed over a long period, leading to a high number of summer days. However, in 2006 significantly higher temperatures than in 2003 were measured over a shorter period, leading to the maximum number of heat days during the entire measurement period.

The Berlin-Grunewald station records by far the fewest summerly threshold days due to the location in a forest area that is peripheral by Berlin standards.

The measurement period being shortened by at least 7 years would tend to play only a minor role in this context, as the preceding years had significantly fewer threshold days (cf. Fig. 3.6 for Dahlem).

Fig. 4.6: Frequency of occurrence of consecutive summer days, hot days and tropical nights for the 23-year period 1988 to 2010 at the Berlin-Grunewald station

Fig. 4.6: Frequency of occurrence of consecutive summer days, hot days and tropical nights for the 23-year period 1988 to 2010 at the Berlin-Grunewald station

Complementing the rise in summer threshold days, the number of frost days decreased in the trend at the Berlin-Grunewald measurement station, if only by about 6 days, whereas the number of days with a maximum temperature under 0 °C (ice days) increased by the same amount (cf. Fig. 4.7).

Fig. 4.7: History of the winter threshold days frost day and ice day at the Berlin-Grunewald station in the measurement period 1988 to 2012

Fig. 4.7: History of the winter threshold days frost day and ice day at the Berlin-Grunewald station in the measurement period 1988 to 2012

Berlin-Tegel

Site

Tab. 5.1: Characteristics of the Berlin-Tegel climate station

Tab. 5.1: Characteristics of the Berlin-Tegel climate station

Photo 5.1: Location of the Berlin-Tegel aviation weather station (see arrow mark)

Photo 5.1: Location of the Berlin-Tegel aviation weather station (see arrow mark)

The Berlin-Tegel measurement station is located on the airport compound in the northeast of the municipal area of Berlin, about 9 km from the city centre. The area to the north and northwest of the airport is characterised by large forest and lake areas, whereas partly dense development is found from northeast to south. The wind measurements are performed at a height of 10 m above ground. The measurements for the station go back to the beginning of 1963.

Long-term mean values

Table 5.2 gives an overview of the long-term monthly mean values of selected climate parameters at the Tegel station in the 30-year period 1981 to 2010 under consideration.

Tab. 5.2: Monthly mean values of climate parameters at the Berlin-Tegel station for the long-term period 1981-2010

Tab. 5.2: Monthly mean values of climate parameters at the Berlin-Tegel station for the long-term period 1981-2010

The climate diagram of the Berlin-Tegel station is shown in Figure 5.1. It shows an averaged history of temperature and precipitation of the individual months of the 30-year period from 1981 to 2010. August is the month with the most rainfall; the least precipitation occurs in the transitional seasons.

Fig. 5.1: Climate diagram for the Berlin-Tegel station for the long-term period 1981 to 2010

Fig. 5.1: Climate diagram for the Berlin-Tegel station for the long-term period 1981 to 2010

The sunshine diagram follows the temperature curve, as expected (cf. Fig. 5.2).

Fig. 5.2: Mean monthly sunshine duration at the Berlin-Tegel climate station for the long-term period 1981 to 2010

Fig. 5.2: Mean monthly sunshine duration at the Berlin-Tegel climate station for the long-term period 1981 to 2010

The following figures show wind direction distributions at the Tegel aviation weather station in the period from 2001 to 2010. In addition to the mean long-term wind direction distribution, distributions for low-wind conditions with speeds up to 2 m/s as well as conditions with wind speeds above 2 m/s were evaluated. Low-wind conditions were recorded in 24.6 % of the cases in the period under consideration. Calms (windless conditions) were observed in 0.6 % of the situations. Wind speeds above 2 m/s occurred in 75.4 % of the evaluated period. The red ring lines in the diagrams indicate the mean frequencies of occurrence of the wind direction in the respective period under consideration in percent. The distance between ring lines corresponds to 1 %.

Fig. 5.3: Mean wind direction distribution in the period 2001 to 2010 at the Berlin-Tegel aviation weather station (measurement height 10 m). The ring lines indicate the frequencies of occurrence of the wind directions, their distance corresponds to 1 %

Fig. 5.3: Mean wind direction distribution in the period 2001 to 2010 at the Berlin-Tegel aviation weather station (measurement height 10 m). The ring lines indicate the frequencies of occurrence of the wind directions, their distance corresponds to 1 %

Fig. 5.4: Frequencies of the wind directions in the annual mean in the period 2001 to 2010 at the Berlin-Tegel aviation weather station by wind speed

Fig. 5.4: Frequencies of the wind directions in the annual mean in the period 2001 to 2010 at the Berlin-Tegel aviation weather station by wind speed

Developments, trends

Figure 5.5 shows the history of the annual mean temperature of the years 1963 to 2013. The trend is increasing in the course of the measurement series, as for all other stations. In Berlin-Tegel, this increase amounts to more than 1.5 Kelvin, the largest increase among the six stations under consideration.

Fig. 5.5: History of the annual mean temperature at the Berlin-Tegel station in the measurement period 1963 to 2013

Fig. 5.5: History of the annual mean temperature at the Berlin-Tegel station in the measurement period 1963 to 2013

Figure 5.6 illustrates the history of the threshold days occurring in summer for the entire observation period 1963 to 2013. Both the summer days and the hot days exhibit a positive trend. The number of summer days per year increased by about 16 days, the number of hot days by about four. The number of tropical nights shows no clear tendency.

Fig. 5.6: History of the threshold days summer day, hot day and tropical night at the Berlin-Tegel station in the measurement period 1963 to 2013

Fig. 5.6: History of the threshold days summer day, hot day and tropical night at the Berlin-Tegel station in the measurement period 1963 to 2013

Although the temperatures at the Berlin-Tegel station rose by 1.6 °C in the last 50 years, there is no marked difference in the increase of summerly threshold days in comparison with the other five stations. In the trend, the number of summer days in 2013 was 16 days above the initial values in 1963; the number of hot days increased by four days.

With respect to the number of tropical nights, the Tegel station has a middle position together with the one in Tempelhof. The highest nocturnal temperature values as well as the highest number of tropical nights (in total and related to individual weather events) are recorded at the inner-city Alexanderplatz (cf. Fig. 2-3). The lowest number is recorded at the peripheral sites Dahlem and Grunewald. This close relationship with the urban location comes about mostly because the nocturnal minimum temperatures more closely reflect the degree of development of the surroundings than the daytime maximum values.

In the period under consideration, a stretch of 8 days with consecutive tropical nights was observed in the time from July 23 to July 30, 1994. This value was not surpassed even in the ‘hundred-year summer’ of 2003 with 67 summer days, 31 of them consecutive from July 14 to August 13, at the Tegel station (cf. Fig. 5.7).

Fig. 5.7: Frequency of occurrence of consecutive summer days, hot days and tropical nights for the long-term period 1981 to 2010 at the Berlin-Tegel station

Fig. 5.7: Frequency of occurrence of consecutive summer days, hot days and tropical nights for the long-term period 1981 to 2010 at the Berlin-Tegel station

Figure 5.8 shows the history of the threshold days frost day and ice day for the period 1963 to 2013. The trend shows a decrease both in the number of frost days and for the ice days. The frost days decreased by 15 days on average, the ice days by 9 days. However, this development is not discernible if only the 30-year period 1981 to 2010 is considered. No trend can be observed in this case (cf. Fig. 5.9).

Fig. 5.8: History of the threshold days frost day and ice day at the Berlin-Tegel station in the measurement period 1963 to 2013

Fig. 5.8: History of the threshold days frost day and ice day at the Berlin-Tegel station in the measurement period 1963 to 2013

Fig. 5.9: History of the threshold days frost day and ice day at the Berlin-Tegel station for the long-term period 1981 to 2010

Fig. 5.9: History of the threshold days frost day and ice day at the Berlin-Tegel station for the long-term period 1981 to 2010

Berlin-Tempelhof

Site

Tab. 6.1: Characteristics of the Berlin-Tempelhof climate station

Tab. 6.1: Characteristics of the Berlin-Tempelhof climate station

Photo 6.1: Location of the Berlin-Tempelhof station (see arrow mark).

Photo 6.1: Location of the Berlin-Tempelhof station (see arrow mark).

Photo 6.2: View of the Berlin-Tempelhof station

Photo 6.2: View of the Berlin-Tempelhof station

The Tempelhof measurement site of the German Meteorological Service is located in the inner-city area, about 2.5 km south of the eastern city centre, on the southern edge of the Tempelhofer Feld, the former central Tempelhof Airport, which is characterised by green and free spaces. The wind measurements are taken at a height of 10 m above ground. Measurements for this station go back to the beginning of 1948.

For the Berlin-Tempelhof measurement station, data from about 65 years of weather records are available for the present evaluations; only the Potsdam time series goes back (albeit significantly) further.

Long-term mean values

Table 6.2 gives an overview of the long-term monthly mean values of selected climate parameters at the Tempelhof station in the 30-year period 1981 to 2010 under consideration.

Tab. 6.2: Monthly mean values of climate parameters at the Berlin-Tempelhof station in the long-term period 1981 to 2010

Tab. 6.2: Monthly mean values of climate parameters at the Berlin-Tempelhof station in the long-term period 1981 to 2010

The climate diagram of the Tempelhof station is shown in Figure 6.1. In Berlin-Tempelhof, the distribution of precipitation in the summer months is slightly shifted with respect to the other stations. The month with the most precipitation in the entire year is already June, not August.

Fig. 6.1: Climate diagram for the Berlin-Tempelhof station for the long-term period 1981 to 2010

Fig. 6.1: Climate diagram for the Berlin-Tempelhof station for the long-term period 1981 to 2010

Fig. 6.2: Mean monthly sunshine duration at the Berlin-Tempelhof climate station for the long-term period 1981 to 2010

Fig. 6.2: Mean monthly sunshine duration at the Berlin-Tempelhof climate station for the long-term period 1981 to 2010

The following figures show wind direction distributions at the Tempelhof station in the period from 2001 to 2010. In addition to the mean long-term wind direction distribution, distributions for low-wind conditions with speeds up to 2 m/s as well as conditions with wind speeds above 2 m/s were evaluated. Low-wind conditions were recorded in 17.5 % of the cases in the period under consideration. Calms were observed in 0.2 % of the situations. Wind speeds above 2 m/s occurred in 82.5 % of the evaluated period. Further, wind direction distributions were evaluated for the summer and winter half-years. For both half-years, winds from 270° occur with the highest frequencies. While the secondary maximum is formed by winds from the east in the summer half-year, winds from southwestern directions occur with the second-highest frequency in the winter half-year.

The red ring lines in the diagrams indicate the mean frequencies of occurrence of the wind direction in the respective period under consideration in percent. The distance between ring lines corresponds to 1 %.

Fig. 6.3: Mean wind direction distribution in the period 2001 to 2010 at the Berlin-Tempelhof climate station (measurement height 10 m). The ring lines indicate the frequencies of occurrence of the wind directions, their distance corresponds to 1 %

Fig. 6.3: Mean wind direction distribution in the period 2001 to 2010 at the Berlin-Tempelhof climate station (measurement height 10 m). The ring lines indicate the frequencies of occurrence of the wind directions, their distance corresponds to 1 %

Fig. 6.4: Frequencies of the wind directions in the annual mean for the period 2001-2010 at the Berlin-Tempelhof climate station by wind speed (measurement height 10 m). The ring lines indicate the frequencies of occurrence of the wind directions, their distance corresponds to 1 %

Fig. 6.4: Frequencies of the wind directions in the annual mean for the period 2001-2010 at the Berlin-Tempelhof climate station by wind speed (measurement height 10 m). The ring lines indicate the frequencies of occurrence of the wind directions, their distance corresponds to 1 %

Fig. 6.5: Mean frequencies of the wind directions in the summer and winter half-years of the period 2001-2010 at the Berlin-Tempelhof climate station (measurement height 10 m). The ring lines indicate the frequencies of occurrence of the wind directions, their distance corresponds to 1 %

Fig. 6.5: Mean frequencies of the wind directions in the summer and winter half-years of the period 2001-2010 at the Berlin-Tempelhof climate station (measurement height 10 m). The ring lines indicate the frequencies of occurrence of the wind directions, their distance corresponds to 1 %

Developments, trends

Figure 6.6 shows the history of the annual mean temperature of the years 1948 to 2013. The trend is increasing over the course of the measurement series, as for all other stations, by about 1 Kelvin. Here, too, a period of significantly lower temperatures between the mid-1950s until around 1970 can be discerned.

Fig. 6.6: History of the annual mean temperature at the Berlin-Tempelhof site in the measurement period 1948 into 2013

Fig. 6.6: History of the annual mean temperature at the Berlin-Tempelhof site in the measurement period 1948 into 2013

For the summerly threshold days, regardless of the respective measurement period Figures 6.7 and 6.8 show a strong increase in summer days, in the longer trend since 1948 by 17 summer days. The number of hot days increases by about six days. While the history of the number of tropical nights exhibits no trend, the relatively high number of nighttime hours with temperatures not below 20 °C at this open site is notable. In the summer of 1994, the highest hitherto recorded number of 10 tropical nights occurred. The warmest summer night was measured with a minimum temperature of 23.4 °C in the summer of 2010 on July 11.

Fig. 6.7: History of the threshold days summer day, hot day and tropical night at the Berlin-Tempelhof station in the measurement period 1948 to 2013

Fig. 6.7: History of the threshold days summer day, hot day and tropical night at the Berlin-Tempelhof station in the measurement period 1948 to 2013

Fig. 6.8: History of the threshold days summer day, hot day and tropical night at the Berlin-Tempelhof station for the long-term period 1981 to 2010

Fig. 6.8: History of the threshold days summer day, hot day and tropical night at the Berlin-Tempelhof station for the long-term period 1981 to 2010

Despite the high number of tropical nights, these mostly occur individually and not consecutively. 1994 is a ‘special’ year with record values: From July 26 to August 2, the temperature did not fall below 20 °C in eight consecutive nights; during the days, too, there was a heat wave, so that on eleven consecutive days (July 22 to August 1, 1994) the daily maximum values were above 30 °C (cf. Fig. 6.9).

Fig. 6.9: Frequency of occurrence of consecutive summer days, hot days and tropical nights for the long-term period 1981 to 2010 at the Berlin-Tempelhof station

Fig. 6.9: Frequency of occurrence of consecutive summer days, hot days and tropical nights for the long-term period 1981 to 2010 at the Berlin-Tempelhof station

The winterly threshold days frost day and ice day exhibited a negative trend also at the Berlin-Tempelhof station. The frost days decreased by about seven days since records began in Tempelhof; the ice days decreased by 4 days per year in the trend (cf. Fig. 6.10).

Fig. 6.10: History of the threshold days frost day and ice day at the Berlin-Tempelhof station in the measurement period 1948 to 2013

Fig. 6.10: History of the threshold days frost day and ice day at the Berlin-Tempelhof station in the measurement period 1948 to 2013

In the representation focused on the 30-year period 1981 to 2010, it is notable that here the trend exhibits an increase in the frost days. This is due to the very high number of these threshold days in 1996 and 2010 (cf. Fig. 6.11 as well as Fig. 5.9 for the Tegel station).

Fig. 6.11: History of the threshold days frost day and ice day at the Berlin-Tempelhof station for the long-term period 1981 to 2010

Fig. 6.11: History of the threshold days frost day and ice day at the Berlin-Tempelhof station for the long-term period 1981 to 2010

Potsdam

Site

Tab. 7.1: Characteristics of the Potsdam climate station

Tab. 7.1: Characteristics of the Potsdam climate station

Photo 7.1: Location of the Potsdam-Telegrafenberg station (see arrow mark)

Photo 7.1: Location of the Potsdam-Telegrafenberg station (see arrow mark)

The Potsdam climate station is the only meteorological station worldwide that exhibits such a comprehensive measurement programme without gaps over a time period of more than 100 years without a change in the site or the measurement and observation methods. It is therefore called a "_long-term meteorological station_". Much further historical and current information about the station is available here: Long-Term Meteorological Station Potsdam-Telegrafenberg (accessed March 15, 2015).

The station lies in the southwest of Potsdam approx. 600 m outside the built-up zone on the elevation of the so-called Telegraph Mountain (Telegrafenberg). It is located at a height of 81 m above sea level on the edge of an expansive forest area. The immediate surroundings of the measurement field are flat and surrounded by trees of 15 – 20 m height at a distance of approx. 50 – 100 m. The measurement meadow has a size of 1,200 m² and adjoins the building of the former Meteorological Observatory, on whose tower both the radiation and wind measurements and, due to the free view in all directions, the ocular observations are carried out (PIK 2015).

Long-term mean values

Table 7.2 gives an overview of the long-term monthly mean values of selected climate parameters at the Potsdam station in the 30-year period 1981 to 2010 under consideration.

Tab. 7.2: Monthly mean values of climate parameters at the Potsdam station for the long-term period 1981 to 2010

Tab. 7.2: Monthly mean values of climate parameters at the Potsdam station for the long-term period 1981 to 2010

Figure 7.1 shows the climate diagram for the Potsdam station. It shows an averaged history of temperature and precipitation for the long-term period 1981 to 2010. Most of the precipitation occurs in the summer months, as is typical of the predominant climate. With 9.34 °C, the average temperature is about half a degree Celsius higher than in the entire measurement period 1893 to 2013.

Fig. 7.1: Climate diagram for the Potsdam station for the long-term period 1981 to 2010

Fig. 7.1: Climate diagram for the Potsdam station for the long-term period 1981 to 2010

Fig. 7.2: Mean monthly sunshine duration at the Potsdam station for the long-term period 1981 to 2010

Fig. 7.2: Mean monthly sunshine duration at the Potsdam station for the long-term period 1981 to 2010

Developments, trends

Fig. 7.3: History of the annual mean temperature at the Potsdam station in the measurement period 1893 to 2013

Fig. 7.3: History of the annual mean temperature at the Potsdam station in the measurement period 1893 to 2013

Figure 7.3 shows the history of the annual average temperature since climate records began on January 1, 1893, up to the end of 2013. In addition to some natural fluctuations, it can also be discerned that the annual mean temperature rises significantly over the course of the measured last 120 years. Whereas in the early measurement years the annual mean temperature was around 8 °C , in recent years average values between 9.5 and 10.5 °C were usually reached. This temperature rise is also illustrated by the trend line.

With an average temperature of 8.85 °C over the entire period, the Potsdam station exhibits the lowest temperature of all stations compared. Besides the peripheral location, which was not subject to significant changes due to construction in its surroundings, a reason for this lies in the long measurement series of 120 years, which also includes temperature values that have not yet been influenced by anthropogenic climate change.

Figure 7.4 shows the histories of the threshold days summer day, hot day and tropical night. The individual trend lines for summer days and hot days illustrate the increase in threshold days in the measurement period. Whereas the number of summer days was 34 per year in 1893, in the trend it increased by 16 to 50 days per year in 2013.

In the development of the hot days, the increase in the case numbers is naturally slowed down and amounts to 3 days in the trend over the entire measurement period. However, here, too, significant fluctuations are observed in the course of the 120 measurement years. With 26 days, the year 1947 recorded the most hot days. With respect to the tropical nights, a clustering in the current decade can be observed.

Fig. 7.4: History of the threshold days summer day, hot day and tropical night for the Potsdam station in the measurement period 1893 to 2013

Fig. 7.4: History of the threshold days summer day, hot day and tropical night for the Potsdam station in the measurement period 1893 to 2013

If only the 30-year period from 1981 to 2010 is considered in Figure 7.5, it becomes apparent that it was primarily in this last quarter of the entire measurement time that most of the increase in the summerly threshold days occurred (in the case of the summer days about 70 % of the total increase).

Fig. 7.5: History of the threshold days summer day, hot day and tropical night at the Potsdam station for the long-term period 1981 to 2010

Fig. 7.5: History of the threshold days summer day, hot day and tropical night at the Potsdam station for the long-term period 1981 to 2010

Under stable summerly high-pressure weather conditions with low winds, an enduring rise in air temperatures may occur over several days or over weeks. Figure 7.6 shows the frequency of consecutive threshold days in the long-term period 1981 to 2010. In the "hundred-year summer" of 2003, daily maximum temperatures were at least 25 °C throughout about four weeks in the period from July 13 to August 12; on 17 of these days the criterion of a hot day was even fulfilled (temperature maximum 30 °C or more).

Fig. 7.6: Frequency of occurrence of consecutive summer days, hot days and tropical nights for the long-term period 1981 to 2010 at the Potsdam station

Fig. 7.6: Frequency of occurrence of consecutive summer days, hot days and tropical nights for the long-term period 1981 to 2010 at the Potsdam station

Due to climate warming, the number of summerly threshold days is increasing, whereas the number of winterly threshold days is decreasing. Figure 7.7 shows the histories for the threshold days frost day and ice day for the entire period 1893 to 2013. The linear trend illustrates that in the last 120 years the number of frost days at the Potsdam station decreased from the initial level of about 100 frost days by 16 days (of which about 9 days in the current 30-year period 1981 to 2010; cf. Figure 7.8); the number of ice days shows a decrease by about 8 days per winter half-year (of which approx. 3 days in the period 1981 to 2010).

Fig. 7.7: History of the threshold days frost day and ice day at the Potsdam station in the measurement period 1893 to 2013

Fig. 7.7: History of the threshold days frost day and ice day at the Potsdam station in the measurement period 1893 to 2013

Fig. 7.8: History of the threshold days frost day and ice day at the Potsdam station for the long-term period 1981 to 2010

Fig. 7.8: History of the threshold days frost day and ice day at the Potsdam station for the long-term period 1981 to 2010

Summary

Development of the air temperatures in summer in the Berlin area up to 2013

The temporal development of the annual mean temperatures was already portrayed in the chapters Methodology and Results of the station evaluations.

Here the essential results of the extensive evaluations shall be summarised once more. For this purpose, Figure 8.1 juxtaposes the main climatological threshold days in their frequency per station.

Fig. 8.1: Mean frequencies of summer days, hot days and tropical nights in the long-term period 1981 to 2010 at the climate stations under consideration in the Berlin area (time series for the Grunewald station: 1988-2012)

Fig. 8.1: Mean frequencies of summer days, hot days and tropical nights in the long-term period 1981 to 2010 at the climate stations under consideration in the Berlin area (time series for the Grunewald station: 1988-2012)

  • The maximum air temperatures of the individual measurement sites do not differ significantly, whereas the nocturnal minimum values on summer days sometimes exhibit marked differences. Typically, temperature differences between urban and rural measurement sites are less pronounced with respect to the daily maxima than with respect to the nocturnal minimum temperatures. The temperature maxima occurring in the afternoons of summer days differ much less, since due to the good mixing throughout summer days temperature differences can more easily be equalised during daytime. At night, the urban buildings only gradually release the stored heat; the increasing stability of the temperature stratification in the lower air layers and the subsiding of the wind reduce equalisation processes.
  • The average nocturnal minimum temperatures on summer days clearly show the described influence of the surrounding buildings and thus the urban heat island effect. The highest nocturnal temperatures were recorded at the inner-city Alexanderplatz station, whereas the lowest nighttime values were measured at the peripheral or more rural sites Dahlem and Potsdam. In relation to the Dahlem and Potsdam sites, the nocturnal temperature level at the Grunewald station increases overall in the course of the recording period. The Tegel and Tempelhof sites take a middle position in their temperature level.
  • For the highest temperatures of a summer, the location of the measurement sites cannot definitely be linked to the relative temperature level that the stations exhibit on average. While the Dahlem and Tempelhof stations are often found in the lower range of the maximum temperatures, the highest maximum values were often reached at the Potsdam station. The temperature level of the inner-city Alexanderplatz station is also at a very high level. The highest temperature of the measurement series under consideration was reached with 38.6 °C on August 9, 1992 at the Potsdam station.
  • The mean diurnal variation on summer days, like the average minimum temperatures, reflects the location of the stations in the city area. The stronger the influence of the surrounding buildings, the smaller the average amplitude of the diurnal variation. The Dahlem and Tempelhof stations exhibit an increase in the mean diurnal variation on summer days. For the Tegel and Potsdam stations, the diurnal variation remained nearly constant in the mean, whereas at the inner-city Alexanderplatz station the amplitude of the diurnal variation showed a decreasing tendency. Increases and decreases in the amplitude of the diurnal variation can be caused through local changes of the heat island effect in the surroundings of the measurement site.
  • An increase in the summer days occurring is exhibited by all stations. Due to the relatively homogeneous maximum temperatures in summer within the city area, the number of summer days at the different stations does not differ markedly. The histories of the individual stations are sometimes hard to distinguish, as the frequencies of the summer days only differ insignificantly. It is notable that not only the temperature level but also the frequency of summer days at the Potsdam station is relatively high up to the early 90s in comparison to the stations in the Berlin city area.
  • As expected, larger differences occur in the number of tropical nights, as the nocturnal minimum temperatures more closely reflect the degree of development of the surroundings. Here the inner-city Alexanderplatz station stands out due to its significantly higher number of tropical nights.