Groundwater Levels of the Main Aquifer and Panke Valley Aquifer 2020

Map Description

The present groundwater contour map describes the groundwater situation of the main aquifer with violet groundwater isolines and the Panke Valley aquifer in north-eastern Berlin with blue isolines. The interval between the groundwater isolines is 0.5 m. These show the potentiometric surface area of the unconfined and confined groundwater, respectively (see also Fig. 3). In areas of the main aquifer with confined groundwater, the groundwater contours are displayed in broken lines. In areas with no main groundwater aquifer, or with an isolated main groundwater aquifer of low thickness, no groundwater isolines are displayed. Those areas are shown with black dots.

The map is based on the topographical General Map of Berlin, scale of 1 : 50,000, in grid format, and the geological outline for the Berlin state territory, at a scale of 1 : 50,000, which was derived from the geological General Map of Berlin and Surrounding Areas, scale of 1 : 100,000. In addition, the used groundwater observation wells, as well as the individual waterworks are indicated, with their active wells and the water protection areas.

Hydrogeological Situation

On the plateaus, the main aquifer is extensively covered by the glacial till and bolder clay (aquitards) of the ground moraines. Wherever the potentiometric surface of the main aquifer lies within such an aquitard, groundwater conditions are confined. In sandy segments above the till or in isolated sand lenses, near-surface groundwater may be formed, which is also called stratum water (see also Fig. 3). After extreme precipitation, it may rise to the surface. The groundwater levels of these locally highly differentiated areas have not been separately determined and portrayed.

In the Panke Valley, on the northern side of the spillway, the Barnim plateau, a major independent coherent aquifer has developed. It is located above the main aquifer, which is covered by the glacial till of the ground moraine (see also Figs. 7 & 8). On the present map, this aquifer is indicated by separate blue groundwater isolines. The glacial till is thinning out toward the Warsaw-Berlin glacial valley and the Panke Valley aquifer is interlocking with the main aquifer.

For more information, see the Groundwater Brochure:
www.berlin.de/sen/uvk/_assets/umwelt/wasser-und-geologie/publikationen-und-merkblaetter/grundwasser-broschuere.pdf (only in German)

In general, the hydraulic gradient in Berlin, and hence, the flow direction, is from the Barnim and Teltow plateaus and the Nauen Plate toward the rivers of Spree and Havel. Depression cones have formed around the wells that were active during the measurement period, and have lowered the groundwater level below the level of the neighbouring surface waters. Thus, in addition to inflowing groundwater from the landside, the water pumped here includes groundwater formed by infiltration (bank-filtered water) from these surface waters (see also Fig. 4c).

Current Situation in May 2020

Figure 10 shows the general development of the groundwater levels as a deviation from the 20-year median from a total of characteristic observation wells in different hydrogeological areas. The reference date for every year is the date for which the groundwater level map is created (May 15th) for the period 2000 to 2020. The location of the hydrogeological areas of the Teltow plateau, Barnim plateau, Warsaw-Berlin glacial valley and Nauen Plate/Grunewald is shown in Figure 11.

Positive deviations from the median indicate high groundwater levels (such as in 2008, 2012 and 2018). Negative deviations represent low groundwater levels (such as in 2007, 2017 and 2020).

Fig. 10: Deviation of the groundwater levels from the 20-year median from a total of characteristic observation wells in different hydrogeological sub-areas of Berlin on the reference date of May 15th in the years 2000 to 2020

In the areas Barnim plateau (orange), Teltow plateau (dark red) and Nauener Platte/Grunewald (yellow), the groundwater conditions are predominantly confined, which is why the levels show larger fluctuations. The influence of the dry weather years is apparent.

In the Warsaw-Berlin glacial valley (green), on the other hand, there are unconfined groundwater conditions and the groundwater levels are subject to less fluctuation. In addition, the groundwater hydraulics in this area are dampened by the regulation of the surface waters.

On the reference date of May 15th 2018, the groundwater levels in all four areas showed still positive deviations due to the heavy rainfalls in 2017. As a result of the dry years 2018 to 2020, the groundwater levels on May 15th, 2020 (as well as on May 15th, 2019) are lower than in the 20-year comparison period.

Fig. 11: Location and number of characteristic observation wells in the different hydrogeological areas

Figure 12 shows the monthly deviation from the 20-year median for the years 2018 (orange), 2019 (light red) and 2020 (dark red). Each hydrogeological sub-space is shown in a separate diagram (a to d).

Fig. 12: Monthly deviations from the 20-year median from a total of characteristic groundwater measuring points for the years 2018 (yellow), 2019 (light red) and 2020 (dark red) for the hydrogeological areas Warsaw-Berlin glacial valley (a), Barnim plateau (b), Teltow plateau (c) and Nauen Plate/Grunewald (d).

The months of the hydrological winter (November to April) are shown first on the x-axis, followed by the months of the hydrological summer (May to October)

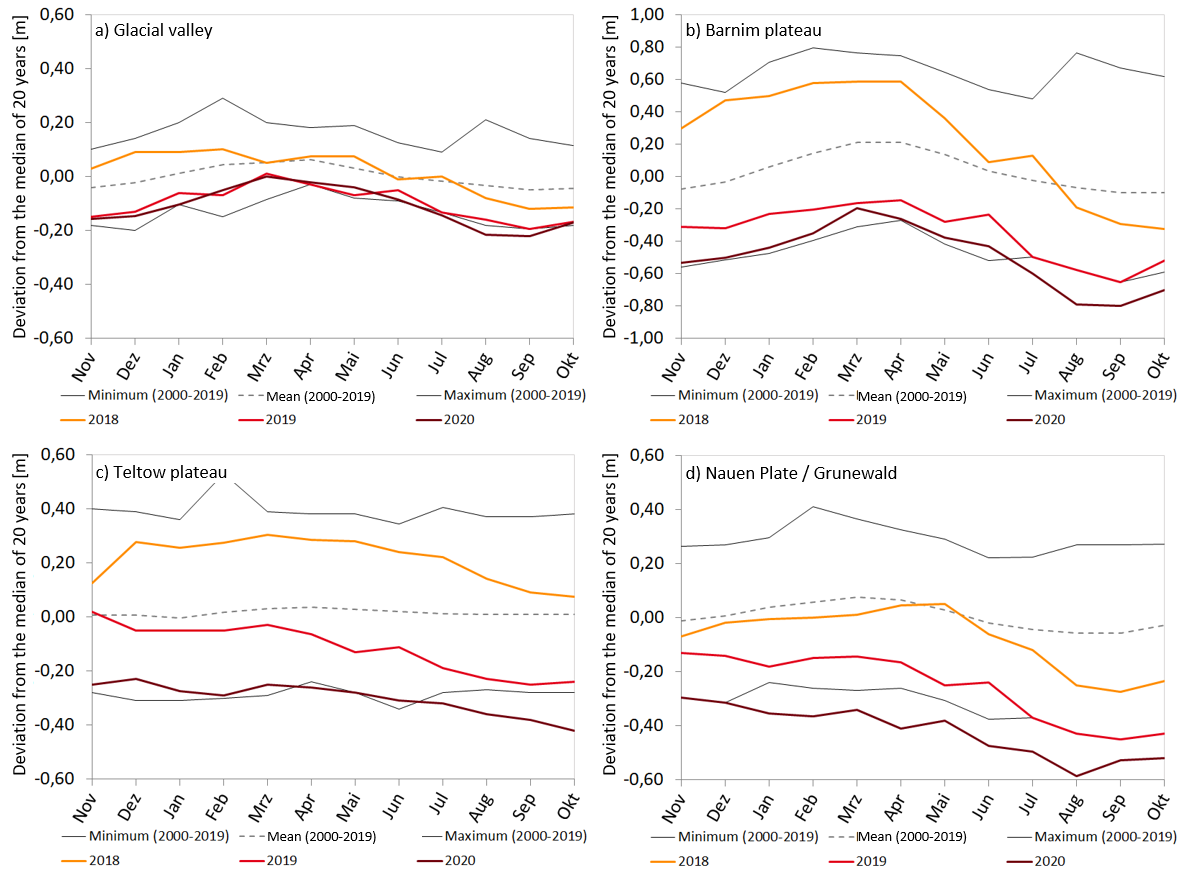
In the Warsaw-Berlin glacial valley (Figure 12a), the low groundwater levels throughout the entire observation period are mainly a result of the dry year 2018. During 2018, groundwater levels decreased by around 0.20 m. This deficit was not restored in 2019 and 2020, which is why the groundwater levels were still below average in these years.

On the Barnim Plateau (Figure 12b), the groundwater levels decreased in the summer period 2018 three times stronger and in the summer period 2020 twice as strong as on average. As a result, the groundwater levels have also been extremely low here in recent years, despite the light saisonal increase during the winter months.

On the Teltow Plateau (Figure 12c), the groundwater levels measured for the hydrological year 2018 were approximately 0.10 to 0.30 m above the long-term mean. Since the hydrological year 2019, the groundwater levels are steadily decreasing and fall below the 20-year minimum groundwater level from July 2020. In October 2020, the groundwater levels were 0.42 m below the mean and thus 0.14 m lower than the lowest values measured in the entire reference period.

In the hydrogeological area Nauen Plate/Grunewald (Figure 12d), the groundwater levels show as well a strong negative trend. At the end of the hydrological year 2018, the levels were around 0.20 m below the long-term mean, at the end of the hydrological year 2019 already around 0.40 m below the long-term mean and at the end of the hydrological year 2020 around 0.50 m below the long-term mean. From January 2020, the values in this area were 0.12 m lower than the lowest values measured in the entire reference period.

The lack of precipitation in 2018 and 2019 results in a delayed reaction of the negative trends in groundwater levels in 2019 and 2020. Because of the drought years, and contrary to the normal seasonal course, there was no increase in groundwater levels between November and April in the hydrogeological areas of the Teltow Plateau and Nauen Plate/Grunewald (Figure 12d) in 2019 and 2020. This suggests that no significant groundwater recharge took place in these areas during the dry years.

The data of the groundwater level measurements and hydrographs of various observation wells are published on the website of the “Wasserportal

From 2000 to 2007, the raw water supply of the Berliner Wasserbetriebe for the public water supply initially decreased. In the years 2007 to 2014, between 202 and 207 million m³ of raw water was pumped per year. Since 2015 there has been an increase in raw water extraction. (Fig. 13).

Fig. 13: Development of the raw water discharge since 2000

From June 2019 until May 2020, the cumulative precipitation amount of 539 mm at the climate station “Berlin-Tegel” was similar to the long-term mean (1981-2010) of 549 mm.

In the months of June, July, September, October and February, the monthly amounts of precipitation exceeded the long-term monthly averages. However, in the months of June and July, the excess can be linked to a few isolated heavy precipitation events while the monthly distribution of precipitation was more balanced in the months of September, October and February.

Deviating from the explanations of the last years, in these years explanations the data from the DWD measuring station Tegel are shown, as there is no data available for the months of May and June 2019 for the otherwise shown measuring station of “Berlin-Tempelhof”.

Fig. 14: Monthly precipitation between May 2019 and May 2020 at the climate station “Berlin-Tegel”, compared with the long-term mean, 1981 through 2010

Information on the expected highest groundwater level (EHGL), which is an important basis for planning the design of buildings, can be found in the Environmental Atlas under: Map EHGL (Limberg et al. 2015).