As required in the “Directive on the Assessment and Management of Environmental Noise”, strategic noise maps graphically represent the noise situation in the following isophone classes:
New
The Environmental Atlas maps are available in the new Map Application
Strategic Noise Maps 2012
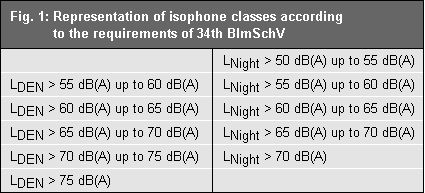
Fig. 1: Representation of isophone classes according to the requirements of the "Directive on the Assessment and Management of Environmental Noise"
Image: Umweltatlas Berlin

Table 4: Number of people impacted in their homes due to road traffic noise on all streets assessed (based on the noise index LDEN)
Image: Umweltatlas Berlin

Table 5: Number of people impacted in their homes due to road traffic noise on all streets assessed (based on the noise index LNight)
Image: Umweltatlas Berlin

Table 6: Plots of land, residences, and school and hospital buildings impacted by road traffic noise on all streets assessed
Image: Umweltatlas Berlin

Table 7: Number of people impacted in their homes due to streetcar and subway noise (based on the noise index LDEN)
Image: Umweltatlas Berlin

Table 8: Number of people impacted in their homes due to streetcar and subway noise (based on the noise index LN)
Image: Umweltatlas Berlin

Table 9: Plots of land, residences, and school and hospital buildings impacted by streetcar and subway noise
Image: Umweltatlas Berlin

Table 10: Number of people impacted in their homes due to industrial noise (based on the noise index LDEN)
Image: Umweltatlas Berlin

Table 11: Number of people impacted in their homes due to industrial noise (based on the noise index LN)
Image: Umweltatlas Berlin

Table 12: Plots of land, residences, and school and hospital buildings impacted by industrial noise
Image: Umweltatlas Berlin

Tab. 13: Number of people impacted in their homes due to aircraft noise from Tegel Airport (based on the noise index LDen).
Image: Umweltatlas Berlin

Tab. 14: Number of people impacted in their homes due to aircraft noise from Tegel Airport (based on the noise index LNight).
Image: Umweltatlas Berlin

Tab 15: Plots of land, residences, and school and hospital buildings impacted by aircraft noise from Tegel Airport
Image: Umweltatlas Berlin

Tab 16: Number of people in Berlin impacted in their homes due to aircraft noise from Schönefeld Airport (2010) (based on the noise index LDEN)
Image: Umweltatlas Berlin

Tab. 17: Number of people in Berlin impacted in their homes due to aircraft noise from Schönefeld Airport (2010) (based on the noise index LNight)
Image: Umweltatlas Berlin

Tab. 18: Plots of land, residences, and school and hospital buildings in Berlin impacted by aircraft noise from Schönefeld Airport (2010)
Image: Umweltatlas Berlin

Tab. 19: Total number of people in Berlin impacted in their homes due to aircraft noise from Tegel and Schönefeld Airports (2010) (based on the noise index LDEN).
Image: Umweltatlas Berlin

Tab. 20: Total number of people in Berlin impacted in their homes due to aircraft noise from Tegel and Schönefeld Airports (2010) (based on the noise index LNight).
Image: Umweltatlas Berlin

Tab. 21: Total of plots of land, residences, and school and hospital buildings in Berlin impacted by aircraft noise from Tegel and Schönefeld Airports (2010)
Image: Umweltatlas Berlin

Tab. 22: Total number of people in Berlin impacted in their homes due to aircraft noise from Tegel and Schönefeld Airports (2010) (based on the noise index LDEN).
Image: Umweltatlas Berlin

Tab. 23: Total number of people in Berlin impacted in their homes due to aircraft noise from Tegel and Schönefeld Airports (2010) (based on the noise index LNight).
Image: Umweltatlas Berlin

Tab 24: Plots of land, residences, and school and hospital in Berlin impacted by aircraft noise from Schönefeld Airport (2015, prognosis)
Image: Umweltatlas Berlin
Environmental Atlas Contact
Berlin Senate Department for Urban Development, Building and Housing
Mrs. Haag