Since the union of the two city halves, residential and commercial buildings – particularly in the eastern part of the city – have been subject to constant change through new construction measures, renovations and shutdowns. This has carried with it rapid change in the heating-energy supply in the city as a whole.
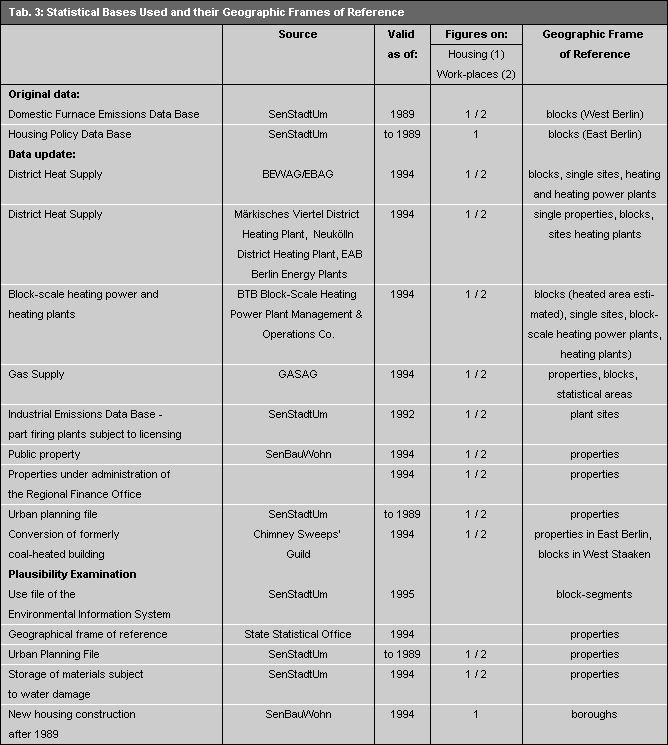
The basic data for the western part of Berlin were provided by the Domestic Heating Emissions Data Base of the Berlin Department of Urban Development and Environmental Protection. These data are as of 1989. In mid-1995, an update of this data base for the whole city was initiated.
For the eastern part of Berlin, the figures of the former East German Housing Policy Data Base were obtained. These data likewise refer to the situation as of 1989.
The lot-level data from both data bases were summed up for the statistical blocks. The area figures from the Emission Data Base for the western part of Berlin represent actually heated areas of housing units. The figures from the East German Housing Policy Data Base are calculated from the number of dwellings multiplied by the average living space size in the statistical block.
Both data bases had to be updated. In addition, the areas available for work-place heating also had to be recorded. Along with other sources, an essential support was provided by the BEWAG and Gas Company (GASAG; cf. Tab. 3).