In Berlin, there are 629,666 buildings, 20,446 (3.2%) of which are underground car parks without superstructures featuring green roofs or green roof areas larger than 10 m². In total, 656 ha of all roof areas are greened (5.4 %) (Tab. 1). Since 2016, the number of buildings with green roofs has therefore increased by 0.2 %. The ‘green roof’ area share even rose from 3.9 % to 5.4 %. Overall, the green roof area grew by 165 ha. A look at the map reveals that green roof areas are concentrated in the inner city of Berlin.
New
The Environmental Atlas maps are available in the new Map Application
Green Roofs 2020
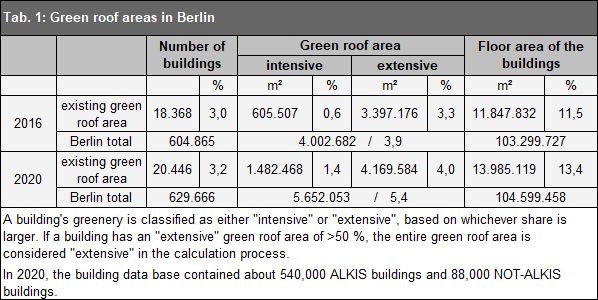
Tab. 1: Green roof areas in Berlin in 2016 and 2020
Image: Umweltatlas Berlin
Tab. 2: Distribution of the green roof areas by building use, 2020
Image: Umweltatlas Berlin
![Fig. 3: Green roof area [m²] – share by building use class, 2020](/imgscale4/ropen/umweltatlas/_assets/nutzung/gruendaecher/en-abbildungen/ea611_03_2020.png)
Fig. 3: Green roof area [m²] – share by building use class, 2020
Image: Umweltatlas Berlin
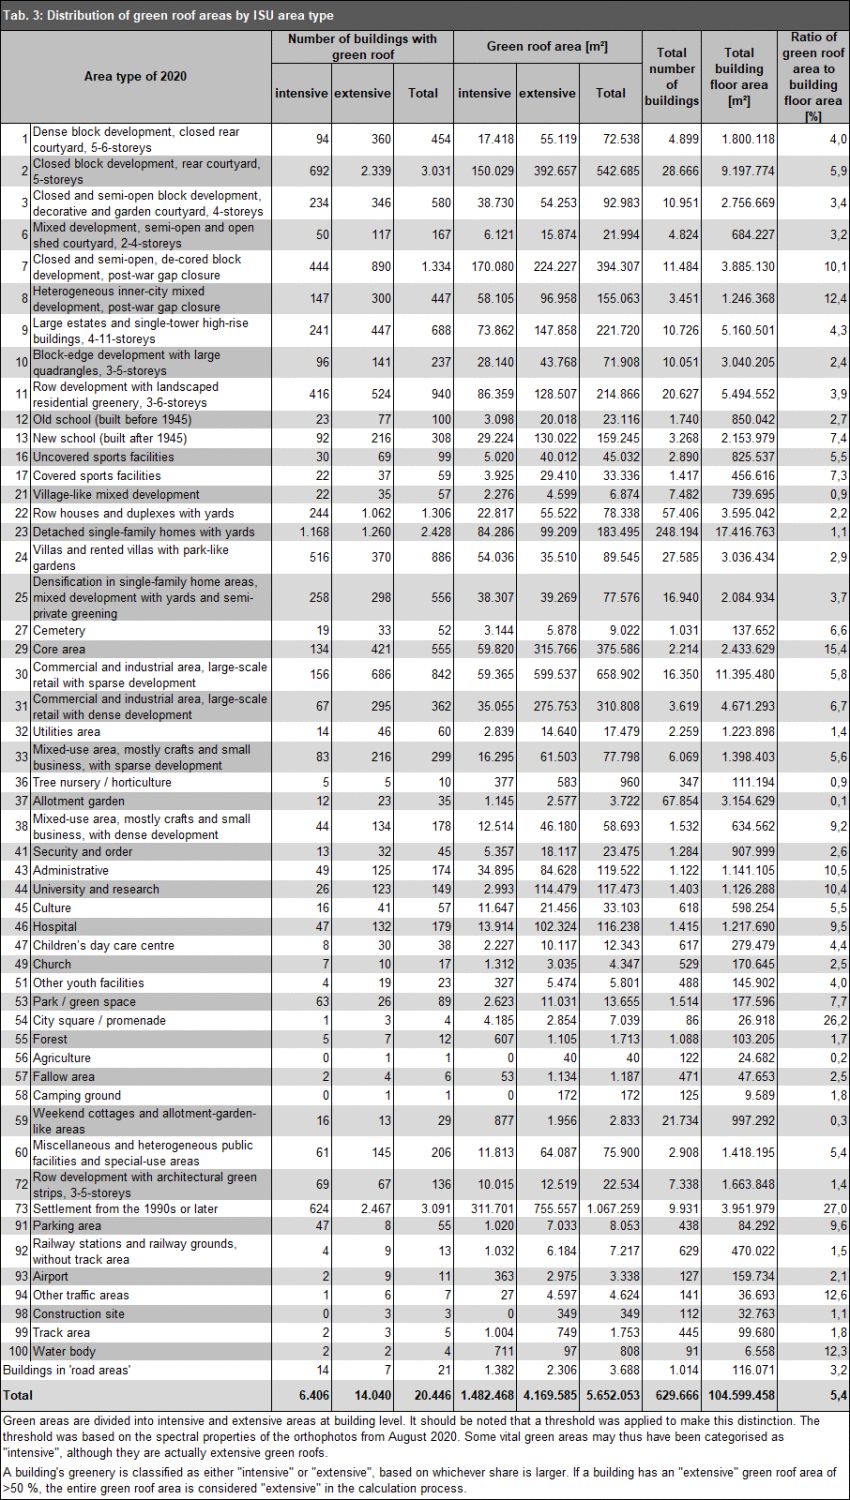
Tab. 3: Distribution of green roof areas by ISU area type
Image: Umweltatlas Berlin
![Fig. 4: Green roof area [m²] by borough, categorised by green roof area share [%], 2020](/imgscale4/ropen/umweltatlas/_assets/nutzung/gruendaecher/en-abbildungen/ea611_04_2020.png)
Fig. 4: Green roof area [m²] by borough, categorised by green roof area share [%], 2020
Image: Umweltatlas Berlin
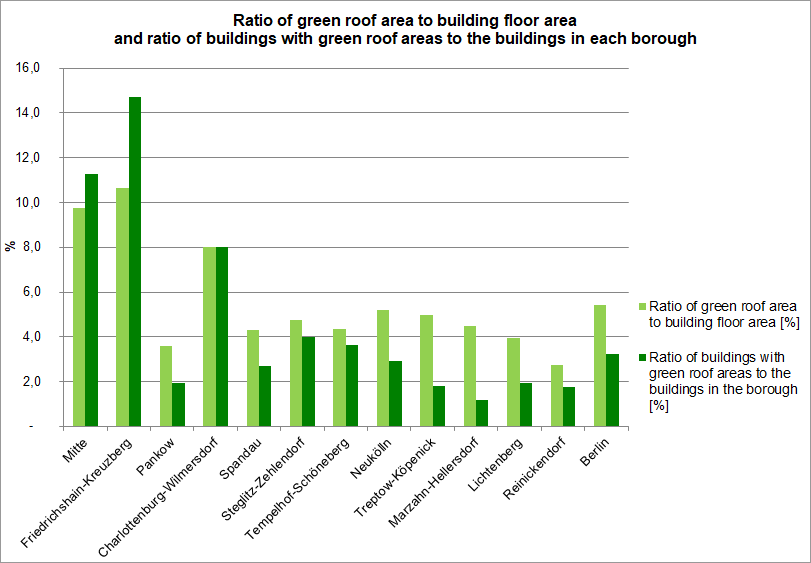
Fig. 5: Ratio of green roof area to building floor area and ratio of buildings with green roof areas to the buildings in each borough, 2020
Image: Umweltatlas Berlin
![Fig. 6: Green roof area [m²] by borough, distinguishing between "intensive" and "extensive" greenery, 2020](/imgscale4/ropen/umweltatlas/_assets/nutzung/gruendaecher/en-abbildungen/ea611_06_2020.png)
Fig. 6: Green roof area [m²] by borough, distinguishing between "intensive" and "extensive" greenery, 2020
Image: Umweltatlas Berlin
![Tab. 4: Distribution of green roof areas by borough (* Ratio of green roof area to building floor area [%]) (Image: Umweltatlas Berlin)](/umweltatlas/_assets/nutzung/gruendaecher/en-tabellen/et611_04_2020.gif)
Tab. 4: Distribution of green roof areas by borough (* Ratio of green roof area to building floor area [%])
Image: Umweltatlas Berlin
Environmental Atlas Contact
Berlin Senate Department for Urban Development, Building and Housing
Mrs. Haag