Given below is a joint description for all the individual evaluations of model calculations. Links are given to the individual focus areas for a faster orientation in the text:
- 04.10.1 Near Ground Wind Field and Cold Air Volume Flow (10:00 p.m. and 04:00 a.m.)
- 04.10.2 Air Temperature (02:00 p.m. and 04:00 a.m.)
- 04.10.3 Radiation Temperature (02:00 p.m. and 04:00 a.m.)
- 04.10.4 Nocturnal Cooling Rate between 10:00 p.m. and 04:00 a.m.
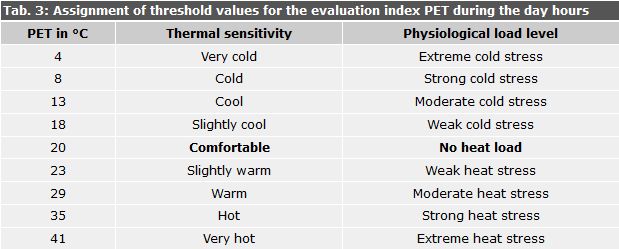
- 04.10.5 Evaluation Index of Physiological Equivalent Temperature (PET)
- 04.10.6 Number of meteorological climatic factors in the middle of the years 2001-2010
- Number of Summer Days
- Number of Hot Days
- Number of Tropical Nights
- 04.10.7 Climate Analysis Map
Within the mentioned topics, the different spatial structures (grid, block) as well as the different points of time and height sections are mapped separately as further differentiations in the maps. These different pieces of information can be selected for each topic via the level switching of the Geoportal .
The model calculations were started in the evening at the time of the sunset and carried out till sunrise of the day after the next. The time sections, in which the model results are to be selected, can be selected freely in principle (minutes till seconds). The individual climatic parameters for the various points of time (MEZ) are evaluated and shown in the form of maps, which permit inferences about the climatic functions and their significance.
The date 10:00 p.m. represents the reversal from irradiation to emission situation shortly after the sunset and stands for the start of a phase with a high cooling dynamics in the differently structured partial areas in the city. The date 04:00 a.m. stands for the maximum cooling within the body of the city in a high summer clear night. Both the points of time are thus relevant mainly for characterising the nightly air-exchange. The time section 02:00 p.m. is also suitable for evaluating the bio-climatic situation during the day, because at this point of time the solar irradiation and consequently also the air temperatures are strongly pronounced. The time of 02:00 p.m. as evaluation time was also necessary for the evaluation of the bio-climatic stresses during the day newly included in the current version of the planning advice map (SenStadtUm 2016).
The analysis maps 04.10.1 to 04.10.5 are present in grid-based as well as block-based form. In doing so, the statistical, not weighted mean value of all grid cells overlapping the block / partial block areas is shown. The meteorological climatic factors (Maps 04.10.6) as well as the Climate Analysis Map (Map 04.10.7), on the other hand, are present only in the form of a block, since these were not modelled directly, but instead were derived from the grid-based results of climate modelling.
Given below is a brief description of individual, exemplary results of model calculations for the complete city area.
In chapter Map Description / Supplementary Notes , a differentiated explanation is provided for an exemplary area in the district of Charlottenburg-Wilmersdorf
Map 04.10.1 Near Ground Wind Field and Cold Air Volume Flow (10:00 p.m. and 04:00 a.m.)
General comments
The good aeration of the settlement areas can lead to a reduction of human bio-meteorological loads (see Moriske and Turowski 2002). Thus, in the night hours, the bringing up of cooler air from the surrounding areas can lower the temperature level of the warmer air masses present in the city, which leads to a reduction of heat load on the people in the summer months. If this introduced cooler air is free of air pollutants (fresh air), the aeration then simultaneously also leads to an improvement of the air-hygiene situation.
For evaluating the aeration situation, consequently, it is necessary to have the suitable assignment of load areas and compensation areas, which provide the correspondingly unloaded air as well as a circulation system, which can bring about the transportation of air masses.
The ground level temperature distribution causes horizontal air pressure differences, which, in turn, are triggers for the local, thermal wind systems. Starting point of these processes are the night temperature differences, which become set between the settlement areas and the open spaces with pronounced vegetation. At the prone areas, the cooled and hence heavy air comes in motion in the direction of the deepest point of the terrain. This gives rise to cold air outflows at the slopes (incl. Mosimann et al. 1999). The wind speed of this small-scale phenomenon is determined primarily through the temperature deficit to the surrounding air and through the inclination of the terrain.
Along with the orographically caused flows with cold air outflow, the so-called floor/structure winds i.e. a direct compensation flow from high to low air pressure are also formed. They arise, when strongly overbuilt or sealed areas get heated more strongly than the surrounding open spaces and, as a result, a thermal trough arises over the urban areas. Consequently, the resulting pressure gradient can be compensated through inflowing cooler air masses from the surrounding regions (Kiese et al. 1992). For characterising these flows, it is important that the air can be accelerated over a certain stretch and is not hindered by the available obstacles, such as the built-up area. The floor/structure winds are closely restricted, often only weakly pronounced flow phenomena, which can be overlaid by a weak overlaying wind. Their speed lies mostly below 0.2 m/s (Mosimann et al. 1999).
The temperature differences typical for land use start building shortly after sunset and can last for the whole night. In doing so, grasslands and arable regions especially prove to be productive of cold air. Depending upon the surface features and cooling rates, the rapid development of cold air streams is associated with this, which at first are very weak vertically (5-10 m layer height) and form between the multitude of areas with different temperatures.
Map contents
Climate-ecological compensatory effects potentially originate from all unbuilt and unsealed areas, inside as well as outside of the city area. To what extent can this potential unfold, depends on the respective boundary conditions, from the size of the area, the vegetation structure, the position in the city area as well as on the surroundings characterised by construction. The large number of open spaces within the city, as compared to the other metropolises, is extremely significant for a city like Berlin not classified topographically to a large extent, because here the city-climatic compensation for the core area of the city takes place primarily through circulations caused thermally, which calls for a highest possible nearness of green and built areas to each other (see Map 04.11.1 Planning Advices Urban Climate 2015, Fig. 8).
The representation of the near-ground temperature field involves the grid instrument of temperature at the near-ground layer of the atmosphere (0-5 m above ground). If several land uses with different area shares are present within a grid cell, the temperature shown is calculated from the proportional weighting. Thus, the simulated temperature values are comparable only for larger areas with a uniform or comparable land use with ground-bound measurements.
Decisive for the temperature distribution are the land-use dependent soil and surface characteristics, as well as their interactions with the atmospheric processes in the near-ground boundary layer. Within the soil, heat and temperature conductivity are of importance in this regard. The greater the heat conductivity of the soil, for example, the faster and more deeply heat can penetrate into the corresponding material – but also: the faster it can escape again.
The surface composition of natural and artificial areas determines, via the albedo (reflection capacity) and the emissivity, the quantity of energy available in the short and long-wave ranges of radiation for warming/cooling. Finally, the turbulence condition of the near-ground atmosphere plays a major role in the transportation of perceptible and latent energy to and from the ground. All processes mentioned are interconnected via the energy balance of the soil, and determine the temperature of the surfaces and the layers of air above them.
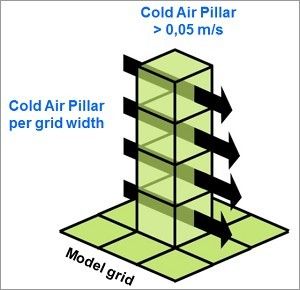
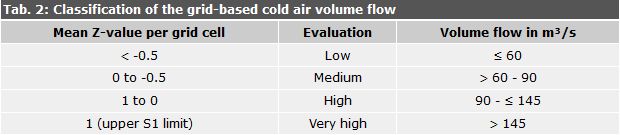
The grid-map levels represent ground level pronounced cold air flow field at a height of 2 m at the night evaluation times of 10:00 p.m. and 04:00 a.m. in 10 m x 10 m resolution as well as at roof level at a height of 22 m above ground. The wind field in the form of direction of flow and flow speed is mapped via the arrow direction and arrow length in the form of vectors for all cells of the model grid with a minimum speed of ≥ 0.05 m/s relevant for the climate. These grid-based data are supplemented by the display of the Cold Air Volume Flow as area value in m3/s. The term of Cold Air Volume Flow implies the product of flow speed of cold air, its vertical (layer height) and horizontal expansion of the flowed cross-section (flow width). It thus describes the quantity of cold air in the unit m3, which flows every second through – in this case – a 10 m x 10 m grid cell (see Fig. 9).