Criteria for the Evaluation of the Soil Functions 2015

Methodology

01.11.1 Regional Rarity of Soil Associations

Description

In order to preserve a large site variety, it is essential to safeguard the existence of as many different soils as possible.

Rarity is used as the criterion to describe the spatial distribution of soil associations in the State of Berlin. Soils occur with varying frequency in the Berlin area. The Soil Association Map provides an overview of the distribution and hence the rarity or frequency of soil associations.

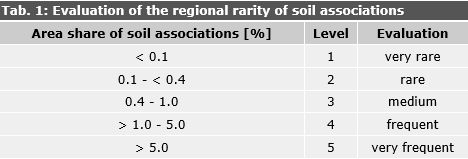
The smaller the area share a soil association occupies, the more endangered it is, i.e. the level of endangerment increases with decreasing area proportions.

Rarity is assessed for soil associations, rather than for individual soil types. Thus, rare soil types may occur in soil associations that are common or not that rare, and vice versa.

Methodology

The spatial shares of each soil association were determined based on data regarding area size provided by the Urban and Environmental Information System. Areas covered by roads and bodies of water were not taken into account. The area sizes were summed up for each soil association, and compared with the total area under observation. As a result, area shares of each soil association are available as percentages of the total area.

To assess the rarity of soils, the method described by Stasch, Stahr and Sydow (1991) was selected. The evaluation was carried out based on the occurrence of soil associations across Berlin.

The rarity of soils was classified into five categories, ranging from “very rare” to “very common” (Tab. 1). Combined associations (cf. Map 01.01) were given the same rating as the soil association with the lowest spatial distribution belonging to the combined association. The conceptual soil association 2471 [49a] was classified as “common”, just like soil association 2470 [49].

Tab. 1: Evaluation of the regional rarity of soil associations

Tab. 1: Evaluation of the regional rarity of soil associations

01.11.2 Special Natural Character

Description

Ice age deposits have given the Berlin area a special natural character that differs considerably from other landscapes in Germany. Particularly striking landscape features include geomorphological peculiarities, such as dead ice sinks, end and push moraines, dunes and former glacial meltwater channels.

Dead ice sinks resulted from blocks of ice remaining from the last ice age which melted away later and which today appear as round, sometimes water-filled depressions featuring groundwater-influenced soils and bog associations. Loamy soils with sandy wedges in which dry fissures were filled with blown drift sand during the late ice age are located on undisturbed boulder marl plateaus, and are recognizable in an aerial view as a regular polygonal network.

End and push moraines are moraines formed by aggradation at the edges of the ice when there was a balance between melt-off and fresh ice. They appear in the landscape today as ridges and hills.

Late and post-glacial dunes are still clearly recognizable from their shapes, but hardly move anymore, due to their covering of vegetation.

The glacial meltwater channels have survived in many cases, and form chains of lakes and wetlands. The soil developments and the occurring soil associations are closely connected with the morphology and the parent materials present. They reflect special characteristics and peculiarities of the natural space here.

Methodology

Only soil associations which are associated with unusual ice-age-related geomorphologically features, and which were able to develop undisturbed by the ice-age deposits were considered. Only near-natural soil associations were included (cf. legend to Map 01.01), as soils of unique character should remain largely unaltered by human use. Soils consisting of land-fills and aggradations, or translocated soil material are not considered to have a unique natural character. Tab. 1 presents an overview of soil associations with natural landscape character, due to their parent material, their special morphology and their largely undisturbed soil development. These include primarily moraine plateaus with sand wedges, moraine hills, glacial meltwater channels with groundwater soils and bogs, river leas with fluvisols, gyttjas and peats, and dunes.

The soil associations listed in Tab. 1 were rated positively in regards to their special natural character. Any remaining soil associations do not show any unique characteristics of a natural landscape.

Tab. 1: Soil associations with a special natural character

Tab. 1: Soil associations with a special natural character

01.11.3 Near-Natural Quality

Description

In the Berlin city area, soils have been changed greatly by anthropogenic influence. The “near-natural” quality describes the extent of those changes compared to the original natural state of the soils. Changes here include the mixing of the soils’ natural horizons, the removal of soil material, or the overlaying with foreign materials. Substance inputs and lower groundwater levels are not considered here. Based on the Soil Association Map and information on land use, an overview of the extent of anthropogenic change, and hence the degree to which Berlin’s soils and soil associations are near-natural is provided.

This aspect is particularly important, as it can be assumed that natural soil characteristics and the diversity of soil properties have primarily been preserved in locations that have undergone little change, whereas anthropogenic influence has led to the homogenization of soil types and their properties. Even the legend items for the Soil Associations Map already distinguish between near-natural and anthric soil associations.

Methodology

To determine the near-natural quality of soils, Blume and Sukopp (1976) introduced the term “hemerobic levels”, analogous to the term hemerobia in botany. Accordingly, various land-use forms were classified into what are called hemerobic levels, according to their degree of cultural effect on ecosystems. Grenzius used this system in 1987 to describe the anthropogenic influence on soils and soil associations in the Map of Soil Associations of Berlin (West), 1985.

Grenzius subdivided the hemerobic levels further, depending on land use (cf. Tab.1). The underlying idea was that the different ways humans use areas cause changes of different types and magnitude as well as the destruction of natural soil.

The classification of the areas is shown in Tab. 1 according to use, by various authors.

Tab. 1: Evaluation of the near-natural quality based on hemerobics

Tab. 1: Evaluation of the near-natural quality based on hemerobics

Since there are no soils in Berlin that remain completely unaltered, the categories of unaltered or very slightly altered soils were not considered. Accordingly, the categories for the evaluation of Berlin soils were redefined, based on the classification criteria of Blume (1990), Grenzius (1985) and Stasch, Stahr, Sydow (1991).

Data on soil associations, use, area type and degree of impervious coverage were used to determine how near-natural soils are. From these values, an automated classification was carried out as an initial aggregation step. This involved developing combinations of soil associations, uses and degrees of impervious soil coverage under partial consideration of the area type. These were then assigned to the appropriate categories for the near-natural quality (levels 1-10 in Grenzius, according to Tab. 1).

Selected land uses, such as green spaces and park facilities, fallow areas etc., required an individual assessment of their near-natural quality. Soils in parks and green spaces as well as in fallow areas may have been altered to varying degrees. In general, inner city soils have either been changed considerably or have been newly formed by anthropogenic aggradation. Oftentimes, near-natural soils associated with the same use are located on the outskirts of the city. Some of these soils may have been altered very slightly. The near-natural quality of these areas was therefore determined on a case-by-case basis with the aid of topographical maps, protected area maps and expert reports.

For the presentation in this map, an assessment based on four categories, ranging from “very low” to “high”, was carried out (cf. Tab. 2, according to Lahmeyer 2000).

Tab. 2: Evaluation of the near-natural quality, based on levels

Tab. 2: Evaluation of the near-natural quality, based on levels

01.11.4 Exchange Frequency of Soil Water

Description

The exchange frequency of soil water indicates how quickly the water in the animate soil zone is replaced by incoming precipitation water. The lower the exchange frequency, the longer the dwell time of the water in the soil. Longer dwell times have a compensating effect on the groundwater flow rate, and permit a more powerful reduction of certain inputs.

Methodology

The exchange frequency of soil water has been calculated as a ratio (quotient) between the percolation (in mm per annum, long-time mean values) and the usable field capacity of the effective root zone (mm).

The percolation was calculated with the help of the ABIMO runoff formation model of the Federal Institute of Hydrology, as the difference between precipitation and evaporation. This model incorporates area-specific data on precipitation, land use, vegetation structure, field capacities (from the soil textures), and depth to groundwater (i.e., from the surface) (Glugla et al. 1999) (cf. Map 02.13.4).

In the determination of the percolation as part of the evaluation of soil functions, the effect of impervious coverage was not considered, i.e. the calculation was carried out under the assumption that the surfaces were completely pervious. In the proximity of impervious soils, exchange frequencies increase considerably again, due to runoff precipitation water.

The usable field capacity of the effective root zone was derived from land use data and the Map of Soil Associations while incorporating the soil profile models devised by Grenzius (1987) associated with the individual soil associations. Since the exchange frequency of soil water is not commonly determined, there are no generally applicable evaluation standards. The values determined for Berlin were thus categorized so that each level covers a similar proportion of the municipal area.

Tab. 1: Exchange frequency levels of soil water

Tab. 1: Exchange frequency levels of soil water

01.11.6 Nutrient Storage Capacity/ Pollutant Binding Capacity

Description

The storage and binding capacity describes the ability of soil to bind nutrients or pollutants to the organic substance or to the clay minerals of the soil. It depends on the clay content, the type of clay minerals and the humus content. Organic material in the form of humus or peat has a considerably higher binding capacity than clay minerals. This is dependent on the pH value, however, and drops with the pH value. Soils with high clay contents and a high proportion of organic substance, with slightly acidic to neutral pH values, therefore have a high binding capacity for nutrients and pollutants.

Methodology

The nutrient storage capacity/ pollutant binding capacity of soils is derived from the levels of the ascertained effective cation exchange capacity (cf. Map 01.06.9), which is very largely reflected by the above-mentioned characteristic values.

The evaluation of the binding capacity is carried out in three steps, according to Tab. 1, from the levels of effective cation exchange capacity, where levels 1 and 2 are combined as low, and levels 4 and 5 are combined as high.

Tab. 1: Nutrient supply levels based on the sum of exchangeable cations

Tab. 1: Nutrient supply levels based on the sum of exchangeable cations

01.11.7 Nutrient Supply

Description

The nutrient supply for a site is determined based on the stock of nutrients and the nutrients available to plants. The nutrient stock consists of the minerals in the parent material, which are released when the soil weathers. The nutrients currently available as base cations of calcium (Ca), magnesium (Mg), potassium (K) and sodium (Na) in the soil solution can be derived from the sum of interchangeable cations. (S-Value) (cf. Map 01.06.08). This provides information on the total volume of base cations only, rather than on the ratio of the cations to each other. For example, a site may therefore be rich in calcium and magnesium, and yet have a potassium deficit.

Only the proportion of base cations was included here, while the nutrients phosphorus (P) and nitrogen (N), which may be derived from the content of organic substances in the soil were left aside.

Methodology

To obtain an overview of the soil associations’ current nutrient supply, the individual levels of the sum of exchangable cations in the topsoil were consulted (cf. Map 01.06.8).

Tab. 1 presents a basic assessment of the nutrient supply based on the base saturation: levels 1 to 6 are nutrient-poor, level 7 is medium and levels 8 to 10 are nutrient-rich.

Tab. 1: Nutrient supply levels based on the sum of exchangeable cations

Tab. 1: Nutrient supply levels based on the sum of exchangeable cations

01.11.8 Water Supply

Description

The water supply of plants depends on the capacity of soil to store precipitated water in the root zone and the ability to release the water back to the plant roots. The quantity of water which soil can retain depends on the soil texture, humus content, bulk density and the proportion of coarse soil. Soils connected to the groundwater benefit from capillary water rising from the groundwater, which may increase the water supply available to plants dramatically.

The average usable field capacity of the shallow root zone is used to assess soils with regard to their water supply.

Methodology

The level of water supply is only needed to evaluate the yield function for cultivated plants (cf. Map 01.12.2) and the habitat function for rare and near-natural plant communities (cf. Map 01.12.1). The water supply of the sites and soil associations is therefore derived from the mean usable field capacity (nFk) of the shallow root zone (0-3 dm) (cf. Map 01.06.2). The water supply for deep-rooted plants (>3 to 15 dm), such as trees, is not determined here. The evaluation is based on Tab. 1. In order to take capillary rise into account, the rating is increased by one level at a depth to groundwater of < 0.8 m (if the water supply has not been rated “high” already).

Tab. 1: Usable field capacity levels and evaluation of the water supply

Tab. 1: Usable field capacity levels and evaluation of the water supply

01.11.9 Filtration Capacity

Description

The filtration capacity of a soil indicates its capacity to bind dissolved and suspended substances in the soil and not let them reach the groundwater. The decisive factor is the soil texture and the resulting speed with which precipitation water moves through it by the force of gravity. Therefore the filtration capacity of gravelly and sandy soils with high water permeability is low, since the water moves more than two meters per day in water-saturated soil. For soils consisting of boulder marl, however, water moves only at a speed of approx. 0.1 to 0.2 metres per day.

How much water – if any – actually moves toward the groundwater (depending on evaporation/ vegetation) though has not been taken into account in the evaluation of the filtration capacity. The Exchange Frequency of Soil Water (cf. Map 01.11.4) addresses this matter to some extent.

Methodology

The filtration capacity of the soils is ascertained on the basis of the saturated water permeability (kf value) (cf. Map 01.06.10). This method disregards the thickness of the filtration path to the groundwater.

Tab. 1 demonstrates the evaluation based on three categories. Soils with a high saturated water permeability, with kf levels 4-6, are assigned a low filtration capacity. Less permeable soils with kf levels 1-2 are assigned a high capacity.

Tab. 1: Filtration capacity levels, based on water permeability levels

Tab. 1: Filtration capacity levels, based on water permeability levels

01.11.10 Binding Strength for Heavy Metals

Description

Heavy metals are bound by adsorption to humic materials, clay minerals and sesquioxides. The solubility of heavy metals depends on their total content and the pH value of the soil solution. The solubility of heavy-metal compounds generally increases with increasing acidification. This is due to the fact that metals tend to form stable oxides at higher pH values, or they tend to enter into not easily dissoluble compounds, e.g. PbCaCO3, by precipitation.

The relative binding strength of heavy metals is one of the components used to evaluate the Filteration and Buffering Function (cf. Map 01.12.3).

Different types of heavy metal are bound differently (DVWK, 1988). Cadmium dissolves relatively quickly. It is a widespread background pollutant in Berlin and is noteworthy regarding its harmfulness. Therefore, the binding strength of cadmium, which is easily soluble, is used here as a benchmark for the binding strength for heavy metals, following the method proposed by the Hamburg Ministry for Environment and Health (2003).

Methodology

Blume and Brümmer (1987, 1991) developed a concept to assess the sensitivity of soil to metal pollution, a concept that is now being implemented throughout Berlin. The assessment is based on the relative binding strength of individual metals depending on the pH value of the soil solution, assuming the conditions of a sandy soil with low sorption and low humus content. Higher humus, clay and iron hydroxide contents are reflected by increases or decreases. The calculation is carried out to a depth of 1 m. For this purpose, characteristic values for the topsoil and subsoil are determined gradually depending on the pH value, the humus content and the clay content. The sum of these yields the BSSM binding strength. This value is adjusted based on the proportion of coarse soil and the horizon thickness. It can range from 0 to 5, reflecting a binding strength of “none” to “very high” for heavy metals.

Tab. 1: Evaluation of the relative binding strength for heavy metals depending on the pH value, humus and clay content, the proportion of coarse soil and horizon thickness

Tab. 1: Evaluation of the relative binding strength for heavy metals depending on the pH value, humus and clay content, the proportion of coarse soil and horizon thickness

01.11.11 Buffering Capacity in the Organic Carbon Balance

Description

As part of the global organic carbon cycle, soil acts as an essential buffer and at times a sink. This lowers the CO2 emission and can therefore contribute to the reduction of global warming. This contribution of the soil is linked to its humus and peat content, which is mainly formed by vegetation inputs. An increased proportion of humus and peat reduces the CO2 emission, whereas the decomposition of humus and peat is a source of CO2. Under natural conditions, a balance between humus forming and decomposing usually sets in over time. Increased humus and peat contents can be found in developing, relatively young soils and in intact bogs. The destruction of soil structures, intensive agricultural use and, in the case of bogs, drainage cause the organic substance to decompose and CO2 and methane (CH4) to be released simultaneously. Gentle agricultural and horticultural use and the spontaneous development of urban (raw) soils lead to an accumulation of organic matter, forming a CO2 sink.

With regard to the organic carbon balance, two soil types characterized by a high buffering capacity may be identified:

  • raw soils, if developed without interference, that are still able to bind large amounts of organic carbon, as well as
  • soils with currently high humus or peat content, the disruption or destruction of which leads to the release of CO2.

While it takes a long time for young soils to bind organic carbon, the release of CO2 after the soil structure has been destroyed, occurs relatively quickly. The release is therefore prioritized and constitutes the only factor that is assessed here.

The total amount of peat and humus stored in Berlin soils corresponds to approx. 17.6 million tonnes of CO2. Berlin’s CO2 emissions amount to approx. 16.5 million t/year (as of 2015, Statistical Office for Berlin-Brandenburg, 2018).

Methodology

The evaluation of the buffering capacity in relation to the organic carbon balance is based on the organic carbon stock levels (cf. Map 01.06.6).

Tab. 1: Evaluation of the buffering capacity in the organic carbon balance based on the organic carbon stock levels

Tab. 1: Evaluation of the buffering capacity in the organic carbon balance based on the organic carbon stock levels