Climate Model Berlin - Planning Advices Urban Climate 2015

Excursus: “Urban climate and health”

Urban climate and health – a challenge for the design of urban living spaces

Human health is the basis of our life. The urban living and environmental conditions significantly influence the well-being, the health and the life expectation for urban populations. The environmental impacts on human health in the context of the urban climate can be derived from the bioclimatic properties of the city, especially as determined by urban heat islands and air pollutants.

Already today, but especially in the future, the specific features of the urban climate in conjunction with the impacts of climate change, the ageing of society, urban lifestyles and an unequal social distribution of environmental loads pose great challenges for the design of urban living spaces.

Since metropolises such as Berlin exhibit an inner-city mosaic of different urban, population and social structures as well as environmental conditions, health impacts are likewise spatially differentiated. Thus, not only the environmental conditions in an urban area are crucial, but also the proportion of the groups of persons who exhibit a particular vulnerability towards these loads. Especially elderly, chronically ill or socially deprived people and those living on their own are often affected by environmental loads to a greater extent (Böhme et al. 2013).

In order to preserve or create an urban environment healthy for humans, it is on the one hand crucial to understand the impacts of the urban climate on health. On the other hand, spatially differentiated considerations concerning human-environment relations in urban areas form an important basis. Urban planning has a significant task in this regard, particularly with respect to the impact of climate change. The Berlin Senate Department for Urban Development and the Environment published the Urban Development Plan Climate (SenStadtUm 2011) in 2011 and developed the partial climate protection concept “Adaptation to the Impacts of Climate Change” (“Anpassung an die Folgen des Klimawandels”, SenStadtUm 2016) in the framework of the climate adaptation strategy of the State of Berlin.

Planning advices maps support the aim of preserving or creating a healthy urban climate. In assessing situations of urban climate load and relief functions and in designating areas with particular urban climate deficits and vulnerability towards the urban climate, demographic structures are taken into account in addition to land use and the supply with green spaces. The identification of increased health risks through thermal load and air pollution on the basis of health-related data in spatial resolution can be understood as an important supplement for the planning and implementation of mitigation and adaptation measures for health protection.

What is the connection between urban climate and human health?

Urban structures modify the bioclimatically relevant parameters air temperature, humidity and airflows, and the exchange of radiation and energy. The urban climate can impact on humans directly and indirectly, since urban heat islands and air pollutants in the urban atmosphere not only have a direct influence on humans, but also on water, soil, flora and fauna in the city. And through these partial spheres (hydrosphere, pedosphere, biosphere), indirect effect pathways to humans can also be traced. In the following, the focus of the considerations will be on the direct impacts of the urban thermal load on human health.

Urban heat islands

The urban heat island has both a beneficial and a detrimental bioclimatic impact on human health. A shortening of the winter frost season and a reduction of the number of heating days, through which air pollutant immissions decrease (Kuttler 1998) and the risk of cold-related illnesses and deaths is reduced, is to be assessed positively. However, shortened frost seasons and milder winters also entail an extension of the vegetation period and thus the pollen season, which can increase and exacerbate allergies and change the allergen spectrum (Eis et al. 2010). Increased risks of infection are also to be expected, as the conditions for alternate animal hosts and carriers (vectors) of pathogenic organisms to live and proliferate are more favourable (Eis et al. 2010). The urban overheating has negative effects especially in the summer months, when the intensity is greatest at night. As these particularly heavy loads coincide with the nocturnal recovery phase of humans, they constitute an additional strain for the human organism on continuously hot days (Koppe et al. 2004). However, high air temperatures, low wind intensities and spatially diverse radiation conditions can lead to heat stress also during daytime in the summer. The degree of thermal load is mainly determined by the insolation.

Heat waves, i.e. several consecutive days with thermal load, are a special problem in cities, as buildings and impervious areas heat up over days, store this heat and release it with a delay. If there is no adequate night-time ventilation in these cases, residents in these urban areas experience a continuous thermal stress across the day and night hours, whereas residents in favourable urban areas experience heat relief overnight through the cooling influence of adjacent open spaces. Berlin distinguishes itself with its outstanding mixture of developed and green areas through a mosaic of different micro-scale climates and thus large differences in the thermal conditions in a small space. Assessing their climatic impact is a priority task of the three-part Planning Advices Urban Climate Map.

Thermal load

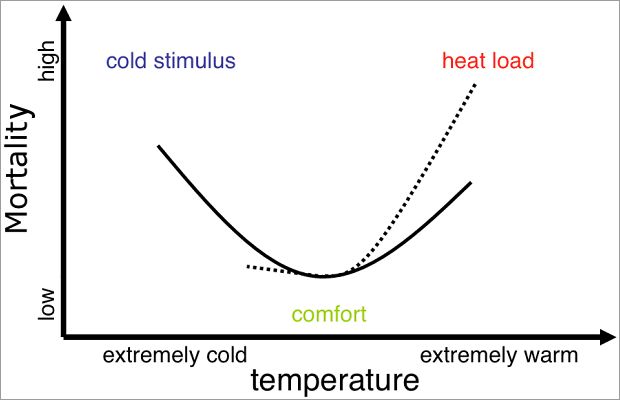
Thermal load is understood as a health-relevant assessment of the thermal environment. The thermal load is determined either by means of simple methods, e.g. threshold values of the air temperature (climatological threshold days), or by means of complex methods, e.g. via the Predicted Mean Vote (PMV), the perceived temperature, the Physiological Equivalent Temperature (PET) or the Universal Thermal Climate Index (UTCI), an update of the Klima-Michel model applied by the German Meteorological Service and of the perceived temperature (Koppe 2005, Jendritzky et al. 2009). The thermal load is divided into heat load and cold stimulus. A severe thermal load is also referred to as a heat load or heat stress, but the terms are often used synonymously and there are no standardised definitions.

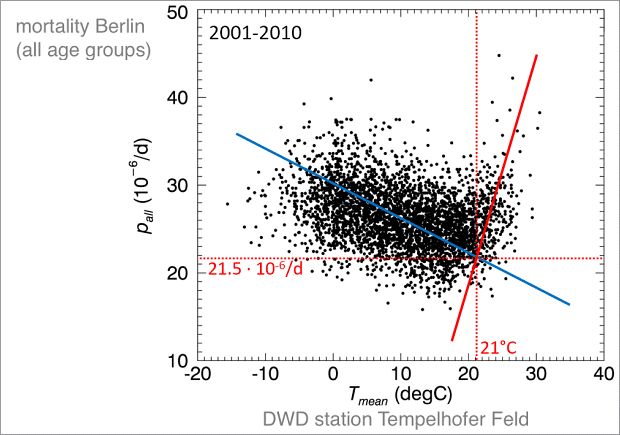
If the mortality (mortality or mortality rate related to the total population) and e.g. the air temperatures are considered across the calendar year, one usually finds a U-shaped curve (cf. Figure 21).

Fig. 21: Schematic representation of the air-temperature-mortality relationship

Fig. 21: Schematic representation of the air-temperature-mortality relationship

h6. Continuous line: Temperature-mortality relationship across the calendar year.
Dotted line: Temperature-mortality relationship during phases of great thermal load or during summer months (Scherber 2014)

The curve progression can vary depending on the regional climate, the season under consideration and the cause of death (Koppe et al. 2004, Michelozzi et al. 2009, Schneider et al. 2009). In the middle latitudes, the total mortality (all causes of death) exhibits a maximum in winter and a minimum in summer. However, in particularly hot summers, as was the case in Berlin in 1994, 2006 and 2010, the total mortality can exceed the winter maximum (cf. Figure 22).

Fig. 22: Daily deaths (all causes) and daily maxima of the Universal Thermal Climate Index (UTCI) in Berlin in 2010 compared to mean values based on 2000-2010

Fig. 22: Daily deaths (all causes) and daily maxima of the Universal Thermal Climate Index (UTCI) in Berlin in 2010 compared to mean values based on 2000-2010

Heat-related diseases

The human organism tolerates deviations of the body’s core temperature only to a small extent. By contrast, the body shell (arms, legs and skin) can tolerate varying temperatures to a much greater extent. If the body’s core temperature increases, if the upper limit of the so-called thermal comfort is exceeded or the human thermal regulation is disturbed, the organism increasingly suffers from heat stress. Even healthy persons can experience significant increases of the pump performance of the heart, even under conditions of physical rest, and may therefore suffer from reduced physiological functional reserves and limited intellectual cognitive performance (BMU 2011). The body reacts with discomfort, reduced physical performance and lack of concentration. Symptoms of heat stress are a feeling of impairment and strain. Increased medication may be necessary for people who are already ill. A continuous exposure to high temperatures can result in heat-related emergency situations (e.g. heat cramps, heat stroke), diseases and even death. Heat-related diseases mainly affect the cardiac, vascular and respiratory system, which is strained due to additional effects of air pollutants and pollen (BMU 2011, Michelozzi et al. 2009, Schneider et al. 2011). In addition, high temperatures and low humidity can dehydrate the mucous membranes, which is relevant both in summer and indoors in winter. Pathogenic organisms which cause diseases of the respiratory system or worsen existing symptoms can easily settle on dry mucous membranes.

h5. Persons at risk and risk factors with respect to thermal load

The water loss via the skin when sweat evaporates significantly increases when the surrounding temperature is higher and is further reinforced under conditions of physical work or an existing disease which is itself water-consuming (e.g. diabetes mellitus, diarrhoea). High water loss is particularly problematic for elderly and sick people, infants and toddlers, as their thermal regulation system is restricted, their perception of thirst is reduced, and the hormonal regulation of the water and electrolyte balance is modified. If the water and electrolyte regulation is not balanced accordingly, the water loss leads to a lack of volume in the circulatory system, and the circulatory function and renal activity are impaired, which may result in the collapse of the organism. In the short term, young adults can compensate even severe water loss solely by drinking. Elderly people often need several days for this (Wichert, von 2004).

People at heat risk further include persons with existing severe health impairments e.g. by diseases of the cardiovascular and respiratory systems and persons who are bedridden or have neurological or psychiatric diseases. They may not be able to provide for themselves independently and usually take medication which impacts on the electrolyte and thermal regulation, e.g. diuretics (flushing out water), neuroleptics (antipsychotic), beta blockers (reducing blood pressure) and barbiturates (enhancing sleep). In addition to age and pre-existing diseases, further risk factors for heat-related diseases are alcohol and drug abuse, exhausting physical activities during extreme weather conditions, lack of acclimatisation, low levels of fitness, overweight, physical fatigue, physical and social isolation, low socio-economic status, living in conurbations and lack of or insufficient air conditioning (Eis et al. 2010, Koppe et al. 2004).

h5. Acclimatisation

Acclimatisation is an essential aspect regarding the impacts of thermal load. Acclimatisation is to be understood as the physiological adaptation of the human organism to changed climatic conditions. The thermal load impacting on the body is reduced through increased efficiency in the thermal regulation system and hormonal changes. A short-term heat acclimatisation is usually reached after 3-12 days, whereas a long-term heat acclimatisation can take several years. The effects of short-term heat acclimatisation include increased sweat production, even at a lower body temperature, and a reduced concentration of salt in sweat and urine. However, this form of acclimatisation is only reached if the heat exposure occurs for several hours daily, and it reverts within several weeks after the heat exposure (Koppe et al. 2004). The speed and extent of the acclimatisation depend on different individual factors such as age, gender, genetic predisposition, state of health, physical performance and fitness. External factors, e.g. the use of air conditioning, and national, geographical and seasonal differences are also crucial for the acclimatisation and individual heat tolerance (Koppe 2005).

Due to the relevance of the physiological adaptation in assessing the thermal environment, the HeRATE method (Heat Related Assessment of the Thermal Environment) was introduced (Koppe 2005). This method is taken into account in calculating the threshold values of the thermal index “perceived temperature” for heat alerts of the German Meteorological Service. For this reason, the threshold values of the perceived temperature for heat alerts are slightly lower for early summer heat waves and at higher latitudes, and slightly higher in midsummer and at lower latitudes.

How can impacts of urban climate on health be studied?

On the one hand, connections between urban climate and human health can be studied on the basis of the impacts of thermal load and air pollution on mortality, morbidity (frequency of diseases), or e.g. on individual physical and psychological parameters. These health indicators often come from data from death statistics, hospital diagnosis statistics (e.g. patient admissions in hospitals), statutory health insurance funds (e.g. billing data) or emergency rescue services. In order to capture thermal load and air pollution, data are obtained from stationary monitoring networks, mobile measurements or based on spatial interpolation.

In investigating the connections between environmental exposures and health impacts, a distinction is made between short-term and long-term effects. Short-term effects occur in immediate temporal proximity to the exposure (i.e. within a few days). However, in the long run chronic diseases may result (Breitner et al. 2013).

On the other hand, the risk for health effects of thermal load and air pollution can also be derived from urban, population and social structures. Taking further health and meteorological indicators into account, this approach results in vulnerability, environmental risk or heat stress maps that spatially represent the potential risk for heat stress or further environmental loads (cf. Chapter “Special vulnerability based on demographic composition”, Dugord et al. 2014, Kim et al. 2014, SenStadtUm 2015d).

The connection between thermal or heat load, air pollutants and health impacts is most frequently investigated on the basis of epidemiological studies. Epidemiology is a scientific discipline that deals with the causes and effects and the diffusion of health-related conditions and events in populations (Mücke et al. 2013). In time series analyses, data from environmental exposures and so-called health endpoints (e.g. disease, death) on the level of aggregated populations (instead of individuals) are taken as a basis, and changes in the strength of environmental influences and certain health effects are investigated using regression analyses in different temporal resolutions (mostly day or month). Possible perturbations, such as seasonal influences, temporal trends, meteorology and socio-economic status of the investigated population can also be taken into account. Since health impacts do not always manifest immediately after changes in the environmental influences, the observed temporal delay of the health impacts is also called a time lag or lag (Breitner et al. 2013). Time series analyses allow for including large numbers of cases and long time periods, and for high resolutions on the spatial level, which is especially relevant for intra-urban differentiations of environmental impacts on the urban population.

However, connections between environmental exposures and health impacts can also be captured on the basis of persons or groups of persons, e.g. by means of case-control studies, cohort studies or by surveying exposed persons regarding their health condition, performance and well-being. These study designs consider fewer case numbers but allow for a better control of confounding factors and for representing connections at the individual level.

Table 3 shows an overview of studies that investigate the impacts of thermal load and air pollution on health in Berlin and specifies the data and the temporal and spatial resolutions used.

Table 3: Overview table of studies investigating the impacts of thermal load and air pollution on health in Berlin (as of 2015, sample)

Urban climate and health in Berlin – an overview of research findings

As early as in the 1980s, Turowski and Haase explored the question which bioclimatic impact factors influence the daily mortality, and they statistically analysed death certificates, including from East Berlin, for the period of 1958-1967 with respect to the influence of climate and weather. The study showed that a higher mortality in the summer half-year was accompanied by higher values of air temperature, humidity and global radiation. The mortality due to diseases of the cardiovascular system was significantly higher in the case of above-average air temperatures in summer in East Berlin (up to 10% deviation from the expected value). For the mortality due to diseases of the respiratory system, the deviation from the expected value was up to 45 %. Using the example of the common cold affecting children in Berlin, a heat island effect could be detected. Children living in the inner city were significantly more frequently affected by the common cold in summer in case of above-average air temperatures, whereas these effects did not show for the outer boroughs (Turowski 1998, Turowski and Haase 1987).

By using data on the total mortality (all causes) and meteorological parameters in day resolution, Gabriel was able to illustrate for the investigation period of 1990-2006 that in Berlin and Brandenburg mainly the elderly (> 50-year-olds) and especially women exhibit a higher heat vulnerability. In the investigation period, the mortality rates were higher during the heat waves (up to 67 % in the summer of 1994 in the Berlin city centre), and a connection between mortality rates and the density of urban structures within Berlin could be detected. The mortality rates increased with the density of urban structures (Gabriel 2009, Gabriel and Endlicher 2011).

For the investigation period of 1998-2010, Burkart et al. showed in a statistical assessment of total mortality, weather and air quality data in day resolution that in Berlin the mortality risk increases with increasing thermal load, and high ozone and fine particulate matter (PM10) concentrations are linked with a higher heat-related mortality (Burkart et al. 2013). As air temperature and air pollution are often closely linked, the study also investigated possible interactions between the thermal load (determined via the Universal Thermal Climate Index) and the ozone and PM10 concentrations, on the one hand, and their influence on mortality, on the other hand. The result shows that the mortality greatly increases under conditions of high thermal and ozone load (cf. Figure 23). These interaction effects are less pronounced for PM10 (cf. Figure 24).

Fig. 23: Connection between thermal load (Universal Thermal Climate Index (UTCI), 2-day mean) and PM10 (2-day mean) as well as the total mortality (logarithmised relative risk) in Berlin. The bivariate response surface model has been adapted for trend, year and day of the week. A logarithmised relative risk of 0.2 corresponds to 22% more deaths

Fig. 23: Connection between thermal load (Universal Thermal Climate Index (UTCI), 2-day mean) and PM10 (2-day mean) as well as the total mortality (logarithmised relative risk) in Berlin. The bivariate response surface model has been adapted for trend, year and day of the week. A logarithmised relative risk of 0.2 corresponds to 22% more deaths

Fig. 24: Connection between thermal load (Universal Thermal Climate Index (UTCI), 2-day mean) and ozone (2-day mean) as well as the total mortality (logarithmised relative risk) in Berlin. The bivariate response surface model has been adapted for trend, year and day of the week. A logarithmised relative risk of 0.2 corresponds to 22% more deaths

Fig. 24: Connection between thermal load (Universal Thermal Climate Index (UTCI), 2-day mean) and PM10 (2-day mean) as well as the total mortality (logarithmised relative risk) in Berlin. The bivariate response surface model has been adapted for trend, year and day of the week. A logarithmised relative risk of 0.2 corresponds to 22% more deaths

Scherer et al. also used data regarding the total mortality (all causes) in order to quantify the mortality in Berlin connected to the thermal load using a heat-event-based risk model. The model identifies heat events based on air temperature data in day resolution. A heat event is defined as a series of at least three consecutive days on which the air temperature exceeds a certain threshold value. The study shows that approx. 5% of all deaths in Berlin between 2001 and 2010 are statistically correlated with increased air temperatures. The persons affected are usually 65 years or older, whereas the connection between increased air temperatures and mortality is statistically not very pronounced in the case of younger persons. The best results were achieved based on daily mean values of the air temperature and when the threshold value of 21 °C was exceeded (cf. Figure 25). On the basis of spatially distributed data, the risk analysis would also be able to take spatial variations of the urban climate and demographic characteristics into account (Scherer et al. 2013).

Fig. 25: Total mortality (all causes), represented as deaths per 1 million inhabitants per day, and daily mean temperatures in the period of 2001-2010. The blue/red line represents the best fit line for the days with low/high air temperatures. The intersection of these lines marks the mean minimum of the mortality rate (21.5 deaths per 1 million inhabitants per day) under conditions of a daily mean temperature of 21 °C

Fig. 25: Total mortality (all causes), represented as deaths per 1 million inhabitants per day, and daily mean temperatures in the period of 2001-2010. The blue/red line represents the best fit line for the days with low/high air temperatures. The intersection of these lines marks the mean minimum of the mortality rate (21.5 deaths per 1 million inhabitants per day) under conditions of a daily mean temperature of 21 °C

The highest so-called excess mortalities, which are understood as heat-related additional mortality (in addition to the base rate of the total mortality) and represent a statistically calculated value, were determined for the years 2006 and 2010 using the heat-event-based risk model by Scherer et al. (2013) (cf. Tab. 4). The studies by Gabriel and Endlicher (2011), Scherber (2014) and Schuster et al. (2014) also show an increased mortality in the particularly hot summers of 2006 and 2010 in Berlin.

Tab. 4: Annual overview regarding the heat-related excess mortality based on the heat-event-based risk model by Scherer et al. (2013). The number of heat waves (heat events) per year (N), the sum of heat wave days per year (days), the mean daily rate of the excess mortality (rate) and the number of excess deaths per year are listed

Tab. 4: Annual overview regarding the heat-related excess mortality based on the heat-event-based risk model by Scherer et al. (2013). The number of heat waves (heat events) per year (N), the sum of heat wave days per year (days), the mean daily rate of the excess mortality (rate) and the number of excess deaths per year are listed

Fenner at al. investigated for the period of 2001-2010 in Berlin to what extent the climatic conditions within densely developed areas differ from conditions in open spaces and outside of the developed urban areas and what effect these conditions have on the mortality risk. The mortality risk (total mortality) was determined with the heat-event-based risk model by Scherer et al. (2013), and the climatological threshold days “hot day” (daily maximum temperature ≥ 30 °C) and “tropical night” (daily minimum temperature ≥ 20 °C) were calculated for the purpose of identifying heat.

While the number of hot days is similar at the four different measurement stations, tropical nights are significantly more frequent within the dense development structure than in open spaces (cf. Figure 26).

Fig. 26: Representation of the number of (a) hot days (Tmax ≥ 30 °C) and (b) tropical nights (Tmin ≥ 20 °C) per year for selected measurement stations in Berlin in the period of 2001-2010.

The dashed coloured lines show the arithmetic mean value of the years 2001-2010 of the respective station. The black hatching shows the number of days on which hot days and tropical nights occurred in combination. Stations: DAHF – Dahlemer Feld, DESS – Dessauer Straße, TGL – Berlin-Tegel, THF – Berlin-Tempelhof. In August 2004, there were measurement failures at the DAHF station. The DAHF and DESS stations are part of the Urban Climate Observation Network of the Chair of Climatology, Ecology Department, Technical University Berlin. The TGL and THF stations are operated by the German Meteorological Service

It becomes clear at all four stations that the majority of the tropical nights occur in combination with hot days (hatching in Fig. 26). From a bioclimatic point of view, these are extremely problematic situations in which people are not only exposed to great heat outdoors during daytime but in which the body can also be subjected to high air temperature in the night hours. For the measurement stations Dessauer Straße (dense development) and Tempelhof (open space), the heat-related additional deaths show that approx. 4-5 % of deaths in the investigation period can be statistically linked with heat events (Fenner et al. 2015).

Deaths are the most serious consequence of environmental impacts. It can be assumed that under extreme environmental conditions even otherwise healthy people are impaired regarding performance and well-being, and that people with a disease-related lack of adaptation capacity react with a deterioration in their condition even to small external perturbations (Laschewski, 2008). In order to establish adequate preventive measures and avoid heat-related deaths, it is important to conduct studies regarding the impacts of thermal load already at the level of health indicators, e.g. cases of disease or treatment or physiological parameters (e.g. physical activity, lung function).

In the summers of 2011 and 2012 in Berlin, clinical studies at the Charité Berlin (Department of Pneumatological Oncology) investigated to what extent thermal load impacts on patients with chronic obstructive pulmonary disease (COPD) or with pulmonary arterial hypertension (PAH) (Jehn et al. 2013, 2014). For this purpose, the lung function, clinical status and physical activity of the patients were determined and assessed depending on the air temperature and the thermal load. The results show that thermal load worsens the patients’ symptoms, yet there are possibilities of reacting to the deteriorations at an early stage, e.g. through telemedical care for the patients (Jehn et al. 2013).

An epidemiological study for the period of 1994-2010 in Berlin investigating the connections between thermal load and air pollution and patient admissions as well as deaths in hospitals has shown that the relative risk for both mortality (deaths) and morbidity (patient admissions) increases from a heavy thermal load onwards (UTCImax = 32 °C) and that particularly elderly people and the chronically ill suffer from heat stress (Scherber 2014). This risk increase is more pronounced for the mortality than for the morbidity. However, it must be taken into account that the case counts for patient admissions are several times higher than for deaths. Besides the cardio-vascular diseases and the totality of all diseases, the diseases of the respiratory system showed the strongest effects of thermal load. Thermal load impacts on both the cardio-vascular system and the respiratory system. The respiratory system is further strained by additional air pollution effects and concomitant diseases (Michelozzi et al. 2009, Schneider et al. 2011). In the investigation of the air pollution effects, fine particulate matter (PM10) has shown the strongest associations, especially for patient admissions and deaths in hospitals with the diagnosis of diseases of the respiratory system (Scherber 2014).

With respect to an increase of the thermal load in Berlin related to climate change (SenStadtUm 2015a), the question arises how thermal load effects could impact on patient admissions and deaths in the close future.

Assuming mean population prognoses (SenStadtUm/AfS 2012) and air temperature scenarios for the daily maximum (STAR2 projections, 2 K scenario, realisation 50) until 2030, an increase in patient admissions and deaths in hospitals could be determined for the summer months for Berlin (Scherber 2014). The increase is most pronounced for ≥ 65-year-olds and diseases of the cardio-vascular system (cf. Tab. 5).

Tab. 5: Expected cases on day basis for fully inpatient admissions (PA) of the total of all age groups and for ≥ 65-year-olds as well as deaths (D) in hospitals for diseases of the cardiovascular (CVS) and respiratory system (RS) in Berlin in the mean of the summer periods (June-September) of 2001-2010 and 2021-2030, taking the influence factors population prognosis, air temperature projections and air temperature effects into account

Tab. 5: Expected cases on day basis for fully inpatient admissions (PA) of the total of all age groups and for ≥ 65-year-olds as well as deaths (D) in hospitals for diseases of the cardiovascular (CVS) and respiratory system (RS) in Berlin in the mean of the summer periods (June-September) of 2001-2010 and 2021-2030, taking the influence factors population prognosis, air temperature projections and air temperature effects into account

As big cities such as Berlin have an inner-city mosaic with respect to urban, population and social structures, health impacts of the thermal load can also exhibit spatial differences.

Spatial epidemiological analyses are thus an important approach for identifying urban areas with increased health risks towards thermal load, especially with respect to the development of specific intervention and prevention strategies in the health system and also, in the long run, for taking them into account in urban planning. For Berlin, deaths and patient admissions in association with thermal load were therefore also investigated with spatial differentiation (Gabriel and Endlicher 2011, Scherber et al. 2014, Schuster et al. 2014).

Schuster et al. considered the total mortality (all causes) for a spatial analysis of heat-related excess mortality at the level of the planning areas (SenStadt 2009) in the investigation period of 2006-2010 for Berlin. The heat-related excess mortality was calculated using the ratio of the total mortality in the hot months of July 2006 and 2010 to the total mortality in the rather cool months of July 2007-2009, which exhibited the lowest monthly means of the daily air temperature maximum in the investigation period (cf. Fig. 27).

Fig. 27: Ratio of the monthly mean of the daily maximum of the air temperature (meteorological stations Tegel, Tempelhof, Schönefeld) to the monthly sum of the deaths (all causes) in Berlin for the month of July in the period of 2001-2010

Fig. 27: Ratio of the monthly mean of the daily maximum of the air temperature (meteorological stations Tegel, Tempelhof, Schönefeld) to the monthly sum of the deaths (all causes) in Berlin for the month of July in the period of 2001-2010

The excess mortality calculation was age-standardised, in order to exclude influences of different age characteristics of the population in individual planning areas (PLAs). The result shows an intra-urban variability of the heat-related excess mortality, expressed via the relative risk (RR) (cf. Figure 28).

Fig. 29: Relative risks for patient admissions in hospitals for ≥ 65-year-olds with diseases of the respiratory system during the summer months of 2000-2009 in Berlin for the patients' places of residence (postcode areas). The red dots indicate the significant clusters with increased risk. Values greater than 1 indicate an increased risk. A value of 1.5 means that the risk in the corresponding cluster is 1.5 times higher than outside of the cluster. In addition, the risks of the postcode areas within the clusters are shown in quartiles

Fig. 29: Relative risks for patient admissions in hospitals for ≥ 65-year-olds with diseases of the respiratory system during the summer months of 2000-2009 in Berlin for the patients' places of residence (postcode areas). The red dots indicate the significant clusters with increased risk. Values greater than 1 indicate an increased risk. A value of 1.5 means that the risk in the corresponding cluster is 1.5 times higher than outside of the cluster. In addition, the risks of the postcode areas within the clusters are shown in quartiles

Planning areas with a higher or lower relative risk were relatively evenly distributed across the city area. An increased relative risk (RR > 1) was determined for more than two thirds of the planning areas, in which a total of 2.26 million out of 3.35 million inhabitants live (as of December 31, 2007). A general mortality gradient from the centre to the outskirts, corresponding to the urban heat island effect, could not be observed. Planning areas with a high relative risk were located both inside and outside of the inner city ring. Planning areas with the highest relative risks (RR > 4) were identified in the borough of Neukölln (PLA Rollberg) but also in outlying areas (PLA Döberitzer Weg, PLA Bucher Forst, PLA Schlangenbader Str.) (Schuster et al. 2014).

If all diagnoses and age groups are included, spatial manifestations of heat-related mortality risks for Berlin show no clear links between densely built-up urban areas and increased health risks. A differentiated look at groups of persons vulnerable to heat yields a different picture.

On the basis of postcode areas, relative risks for patient admissions and deaths in hospitals during the summer months in the period of 2000 – 2009 were correlated with spatially resolved data on thermal load (SenStadtUm 2010b) (Scherber 2014). A significant weakly positive connection could be identified between the mean thermal load and the relative risks for patient admissions with diseases of the respiratory system for ≥ 65-year-olds at the postcode level (patients’ places of residence) (Scherber et al. 2014). The different population shares of the ≥ 65-year-olds in the postcode areas were not taken into consideration. Since diseases of the respiratory system and an age above 65 are among the risk factors towards thermal load, these groups are particularly relevant. In a search for spatial clusters with increased relative risks (as a risk rate) for patient admissions with diseases of the respiratory system affecting ≥ 65-year-olds, five significant clusters could be identified (cf. Fig. 29). Within these clusters, the following places of residence of the patients exhibit the highest relative risks (RR > 1.5): the districts Gesundbrunnen, Mitte, Moabit, Tiergarten and Wedding in the borough Mitte and the district Neukölln in the borough Neukölln. These urban areas exhibit both high densities of development and high thermal loads in summer, and at the same time they have socio-economic conditions detrimental to health (SenGUV 2011, SenStadtUm 2015d).

Relative risks for patient admissions in hospitals for ≥ 65-year-olds with diseases of the respiratory system during the summer months of 2000-2009 in Berlin

Fig. 29: Relative risks for patient admissions in hospitals for ≥ 65-year-olds with diseases of the respiratory system during the summer months of 2000-2009 in Berlin for the patients' places of residence (postcode areas). The red dots indicate the significant clusters with increased risk. Values greater than 1 indicate an increased risk. A value of 1.5 means that the risk in the corresponding cluster is 1.5 times higher than outside of the cluster. In addition, the risks of the postcode areas within the clusters are shown in quartiles