Traffic Volumes ADT 2014

Map Description

The traffic load is not evenly distributed across the Berlin road network. There is a clearly visible concentration on the route sections of the city expressway and on the routes leading to the city centre from the surrounding areas, which mostly serve as federal highways.

Table 6 illustrates the road sections with the highest weekday traffic loads with respect to the overall data for motor vehicles and trucks. The weekday loads on the sections of the A100 between Alboinstraße and Tempelhofer Damm and between Dreieck Charlottenburg and Spandauer Damm are among the highest nationwide with more than 167,000 motor vehicles/24 h. These sections are thus among the three road sections with the highest daily loads in Germany (a list of the “Top 10 of the daily traffic load (ADT) in the German highway system in 2015” can be found here). With respect to the peak truck loads, the distribution on the individual highway sections is similar; however, it is different on urban roads, as the location of inner-city commercial and industrial areas influences the distribution of truck journeys.

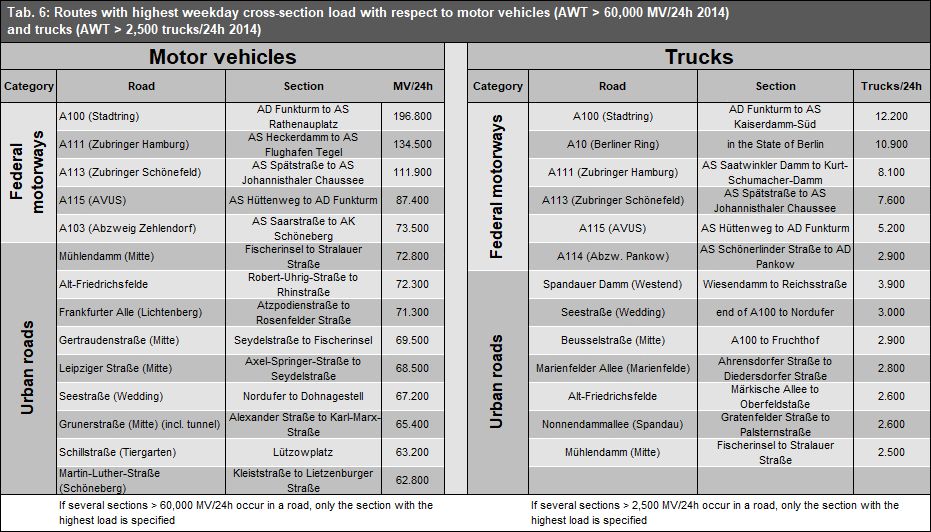
Tab. 6: Route sections with highest weekday cross-section load (AWT/24h) for motor vehicles and trucks in 2014

Tab. 6: Route sections with highest weekday cross-section load (AWT/24h) for motor vehicles and trucks in 2014

With respect to the last analysis in 2009, the average daily traffic load (ADT), as assessed by the driving performance km/day, has slightly decreased, although the route network covered has increased by almost 11 %. The largest share of the newly included road sections exhibits ADT below 10,000 motor vehicles. Some sections of the secondary road network that are relevant to traffic were included here.

Thus, in a comparison focused on the load classes with a ADT > 10,000, their share was 32 % of the route length and more than 60 % of the daily driving performance in the 2009 analysis, compared to 27 % and 56 % with respect to the 2014 annual count.

Despite an increase in the absolute number of registered cars (60,000 more in 2014 compared to 2009, cf. Fig. 1), the traffic load (km/day) has thus decreased in the overall counting network. However, the shares are distributed unevenly across the individual load classes.

Although higher-emission old cars are continually being replaced by lower-emission new cars and the pollutant emissions thus tend to decrease despite an increase in vehicle performance, many other problems caused by traffic, such as tyre dust (which is independent of the drive technology), noise pollution and the enormous demand for space of stationary and moving traffic, will remain as a serious impairment to the urban quality of life (cf. maps 03.11.2 Traffic-Related Air Pollution along Streets 2015 and 2020 (SenStadtUm 2016) and 07.05 Strategic Noise Maps (SenStadtUm 2013)