The percentage areas of the different percolation water rates according to Map 02.13.2 and the derived new groundwater formation rates (Map 02.17) are shown in Figure 2. The category with >150-200 mm/a predominates. A shift from higher to lower values occurs in the new groundwater formation values compared with the percolation water rate (due to the reduction in confined areas), which is mainly reflected in the mean values. Thus, the percentage areas of category >50-100 mm account for 10.5 % of the percolation water rate, but for only 23.4 % the new groundwater formation rate. On the other hand, the percentage areas for the percolation water rates of the categories above 150 mm are all larger than for new groundwater formation rates.
The Environmental Atlas maps are available in the new Map Application
New Groundwater Formation 2017
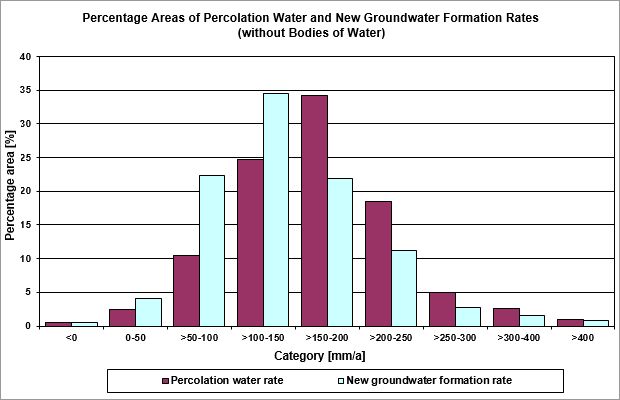
Fig. 2: Percentage areas of percolation and water new groundwater formation rates (without bodies of water) (as of 2017)
Image: Umweltatlas Berlin
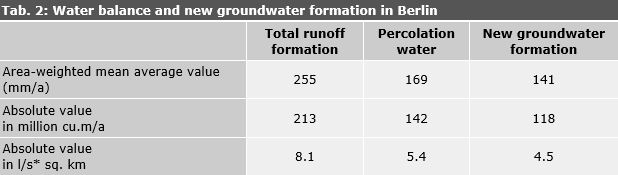
Tab. 2: Water balance and new groundwater formation in Berlin, as of 2017
Image: Umweltatlas Berlin
Remarks:
All values not including bodies of water. The shares of bank filtrate (which e.g. are pumped into the Berlin waterworks from the Havel and Spree Rivers) are not taken into account in the percolation water or new groundwater formation.
Environmental Atlas Contact
Berlin Senate Department for Urban Development, Building and Housing
Mrs. Haag