Traffic-related Emissions and Immissions 2005

Map Description

Index of the Atmospheric Pollution from PM10 and NO2 in 2005

Measurements of the concentrations are only representative for a limited area around the measurement point, and particularly for the particulate PM10, strongly dependent on meteorological conditions.

These dependences will become clear on the basis of the following representations in Figure 9 to 11.

The trend of PM10 daily mean values in 2002, 2005 and 2007 at the measurement stations of BLUME measurement network

Fig. 9: 90.41% value of particulate concentration PM10 [µg/cu.m.] in 2002 at the measurement stations of the BLUME measurement network.

Fig. 9: 90.41% value of particulate concentration PM10 [µg/cu.m.] in 2002 at the measurement stations of the BLUME measurement network.

Fig. 10: 90.41% value of particulate concentration PM10 [µg/cu.m.] in 2005 at the measurement stations of the BLUME measurement network.

Fig. 10: 90.41% value of particulate concentration PM10 [µg/cu.m.] in 2005 at the measurement stations of the BLUME measurement network.

Fig. 11: 90.41% value of particulate concentration PM10 [µg/cu.m.] in 2007 at the measurement stations of the BLUME measurement network.

Fig. 11: 90.41% value of particulate concentration PM10 [µg/cu.m.] in 2007 at the measurement stations of the BLUME measurement network.

The daily mean value of particulate concentration PM10 of 50 µg/cu.m, corresponding to the value 90.41 %, may not be exceeded on more than 35 days a year.

Evaluations of the causes of particulate pollution show that approximately half of the particulate concentration in traffic near test points in central Berlin stem from sources outside the Berlin area. Depending on the process of meteorological conditions, this external influence can lead to a more or less strong transgression particularly of the second PM10 limit value. No more than 35 transgressions of a daily mean average value of 50 µg/cu.m of particulate PM10 are permitted.

While the short term limit value in some cases considerably exceeded in 2002 and 2005, according to measurements (e.g. 2005: 82 transgressions at the Frankfurter Allee measurement point), in 2007, favourable meteorological conditions, with a large number of west wind weather situations causing a high degree of air exchange, caused not only the mean annual value to be met at all measurement points for the first time, but the results also were below the second limit value.
However, this proven external influence on the particulate concentration does not provide any excuse to fail to make an effort locally to ensure a permanent reduction in PM10 pollution.

For a complete picture of the existing pollution and the distribution of pollutants in the municipal area beyond the information obtained from the BLUME measurement stations, elaborate model calculations were carried out in the context of the development of the Berlin Clean Air Maintenance and Action Plan for 2005-2010, as described above in detail in the chapter on Methodology, with reference to the canyon streets. These were based on weather conditions and traffic and emissions data from 2005.

The municipal background PM10 pollution for the exemplary year 2002 is shown in Figure 12; it shows a noticeable increase in values as one moves from the outskirts towards the city centre, i.e., the area within the urban rail (S-Bahn) Ring Line (the “big dog’s head”).
The concentration calculated for the inner city of between 25 and 30 µg/cu.m. is representative for the pollution in residential areas with low traffic and a considerable distance from industrial plants.

Fig. 12: PM10 pollution (annual mean) in the Berlin municipal background, calculated with IMMISnet and measured by BLUME measurement stations for the base year 2005

The calculation of the PM10 and NO2 immission shown on the Map was carried out on the primary road network using the IMMISair model, complemented by a detailed data display for each street section assessed. This results from the overlaying of the respective concentration in the municipal background and the calculated additional pollution from local traffic in the respective section of each major street.
All street sections shown in red show transgressions of the PM10 limit values for 24 hours and/or the annual mean average value of NO2 in terms of the year 2005 (cf. Table 2).
As of 2015, an EU-wide limit value of an annual mean of 2.5 µm (PM2.5) is provided for very fine particulate matter smaller than 25 µg/cu.m. Those sections in which limit value transgressions were calculated were therefore classified as “very high pollution levels”, and will furthermore require special attention in future with regard to minimising near-surface air pollution. These sections are distributed throughout the city; however, they are concentrated in a ring around the inner city, on the major radial roads leading to the south and the east, and on the important connecting roads within Berlin, such as the Bismarckstr./Kaiserdamm corridor in Charlottenburg, Tempelhofer Damm including its southward extension, Frankfurter Allee, and Adlergestell in Treptow-Köpenick. The total length of these street sections adds up to approx. 163 km of roadway, and thus accounts for 12 % of the primary road network; more than 63,000 people live along these streets (cf. Table 4).

Most persons affected live in the area of the so-called “big dog’s head”, and along the radial roads. The urban motorway, which stands out for very high values on the Map in fact affects only a few residents, since the distance to residential areas is relatively great, and the air is well mixed, due to the open situation of the motorway.
Moreover, the Map indicates that a quarter of all sections exceed the index value of 1.76 to 2.00. This 294 km long part of the primary road network may constitute a problem in future, at least in some areas, since at least one parameter generally shows a transgression of the respective limit value here.

Tab. 4: Section lengths of the air pollution index and affected residents in the primary road network of Berlin, 2005

Tab. 4: Section lengths of the air pollution index and affected residents in the primary road network of Berlin, 2005

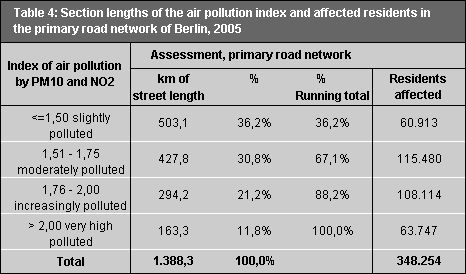
The approach used to calculate the number of residents affected by limit value transgressions was also taken from the noise mapping procedure (see Maps 07.05 Strategic Noise Maps, 2008 Edition)). The number of residents in the flats facing the street front was counted. The number of citizens affected by limit value transgressions thus ascertained represents a rather conservative estimate, because the pollutants spread everywhere, so that increased concentrations can also occur outside highly polluted canyon streets.

Calculated trends through 2015 for the substances PM10 and nitrogen dioxide (NO2)

With regard to permanent compliance with limit values for clean-air maintenance, the calculation of trend scenarios is of great importance. It permits the future development of large-scale and local air pollution to be assessed, and also enables an evaluation of whether additional measures beyond those already initiated are necessary to achieve a reduction in air pollution. The immission values for 2005, which are also the basis for the calculation of the air pollution indices, constitute the point of departure. The resulting trend scenario takes into account the reduction on the emissions side at the trend point in time 2015, for Europe and Germany, and also at the local level in Berlin. Thus, progress due to the implementation of European regulations for pollutant emissions by plants, power stations and motor vehicles is incorporated, as are agricultural emissions of particulate matter.
The exhaust emissions from motor vehicle traffic is likely to decrease, due to the gradual removal of older vehicles with high pollutant emissions; by 2015, this will amount to almost 40% for nitrogen oxides and more than 50% for particulates. However, the particulate produced by the abrasion of the road, tyres and brakes, as well as by the stirring up of street dust by the wind will increase insignificantly, due to increased driving activity.

In sum, the result for Berlin will be a drop in NOx emissions by more than 21 % and in PM10 emissions by about 7 % by 2015, in comparison with 2005 levels.

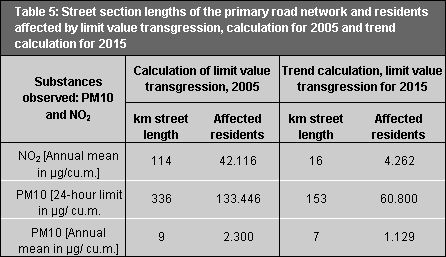
In order to comply with the 24 hr limit value for particulates everywhere, a considerably greater reduction in concentrations will however be required. Nonetheless, such an improvement cannot be expected without additional reduction measures, either for the local nor for the imported portion of particulate pollution, so that even in 2015, it can be assumed that some 153 km of primary road network, with some 61,000 affected residents will show transgressions of the 24 hr value for PM10 (cf. Table 5). Such additional measures must be taken in Berlin, at the national and at the European levels, to reduce both shares further.

A similar result can be predicted for the development of nitrogen dioxide pollution. The measures of the trend scenario already initiated will cause the concentration on the major streets to drop considerably by 2015, which will also reduce the number of streets with limit value transgressions and the residents affected by about 86 %. However, additional measures, mainly in Berlin, will be required to relieve the remaining almost 16 km of streets and the 4,300 (check) people affected who live on them.

Tab. 5: Section lengths and residents affected by limit value transgressions in the primary road network, calculation for 2005 and trend calculation for 2015

Tab. 5: Section lengths and residents affected by limit value transgressions in the primary road network, calculation for 2005 and trend calculation for 2015

In sum it can be stated that:

  • on the measures side in Berlin, the emission of pollutants of industrial plants has been reduced considerably under the limit values stipulated since 2007;
  • the measures already realised or initiated will cause the particulate pollution levels in municipal residential areas to decline by 7-10 %, and the nitrogen dioxide levels by 22 %, by 2010;
  • this reduction will suffice to enable the limit values defined as annual means for particulates to be complied with, even in years with unfavourable weather conditions, to more than cut in half the total length of street sections with transgressions of the 24 hr. limit value for particulates by 2015, and to reduce the annual limit value for nitrogen dioxide by almost 90 %.

The Berlin Clean Air Maintenance and Action Plan for 2005-2010 adopted by the Berlin Senate in August 2005 describes in detail the additional possible measures and their effects on air quality.