Flood Hazard and Flood Risk 2019

Maps

Vorschau

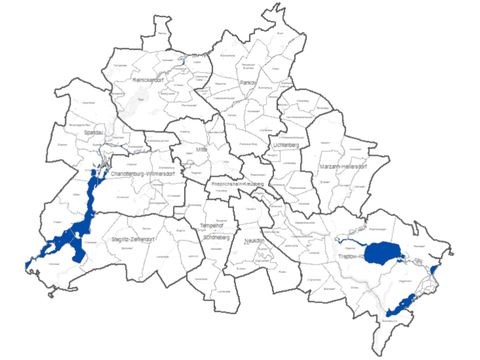
02.23.1 Flood hazard map for floods with high probability

This Flood Hazard map shows the extent of the spread and the water depth in case of river flooding for “high probability” scenarios. Floods caused, for example, by sewage plants exceeding their capacity or by heavy rainfall are not included here. 02.23.1 Flood hazard map for floods with high probability

Vorschau

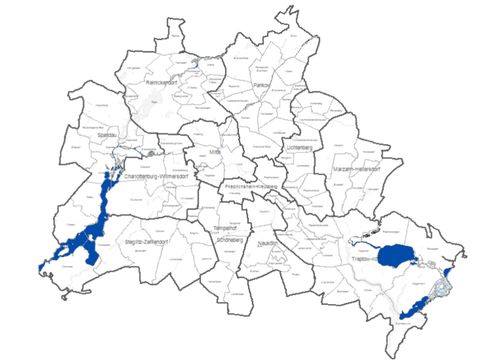
02.23.2 Flood hazard map for floods with medium probability

This Flood Hazard map shows the extent of the spread and the water depth in case of river flooding for “medium probability” scenarios. Floods caused, for example, by sewage plants exceeding their capacity or by heavy rainfall are not included here. 02.23.2 Flood hazard map for floods with medium probability

Vorschau

02.23.3 Flood hazard map for floods with low probability

This Flood Hazard map shows the extent of the spread and the water depth in case of river flooding for “low probability” scenarios. Floods caused, for example, by sewage plants exceeding their capacity or by heavy rainfall are not included here. 02.23.3 Flood hazard map for floods with low probability

Vorschau

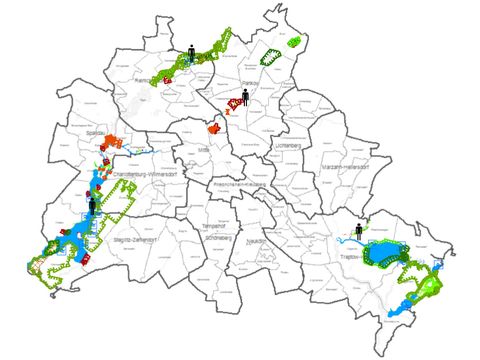
02.23.4 Flood risk map for floods with high probability
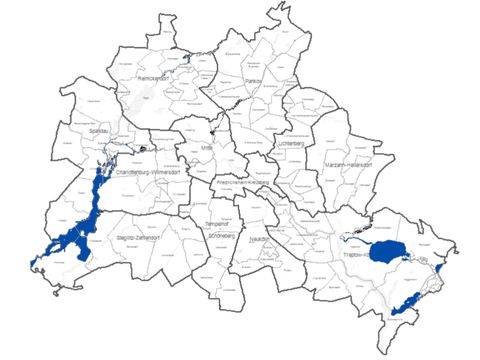
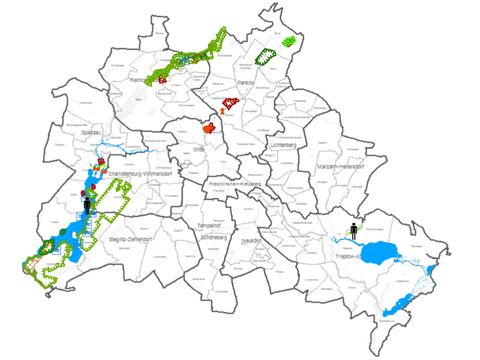
This Flood Risk map displays the potential flood damage for “high probability” scenarios. It provides information on the number of inhabitants that are potentially at risk as well as economic activities, UNESCO World Heritage Sites and conservation districts that may be affected. 02.23.4 Flood risk map for floods with high probability
Vorschau

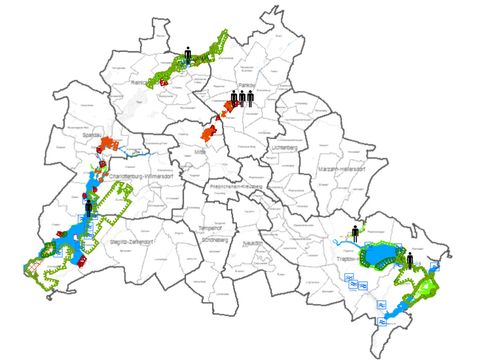
02.23.5 Flood risk map for floods with medium probability

This Flood Risk map displays the potential flood damage for “medium probability” scenarios. It provides information on the number of inhabitants that are potentially at risk as well as economic activities, UNESCO World Heritage Sites and conservation districts that may be affected. 02.23.5 Flood risk map for floods with medium probability

Vorschau

02.23.6 Flood risk map for floods with low probability

This Flood Risk map displays the potential flood damage for “low probability” scenarios. It provides information on the number of inhabitants that are potentially at risk as well as economic activities, UNESCO World Heritage Sites and conservation districts that may be affected. 02.23.6 Flood risk map for floods with low probability