Groundwater Temperature 2015

Maps

Vorschau

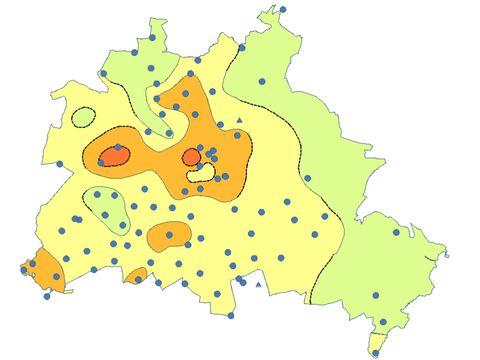
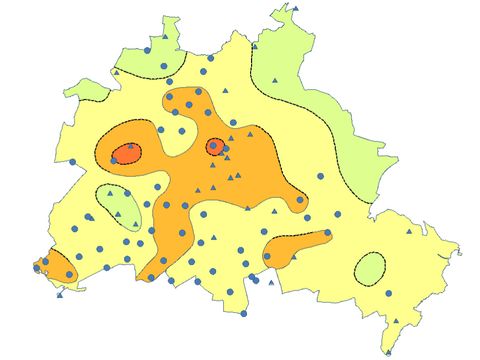
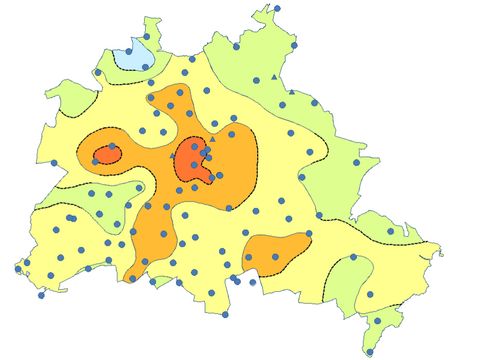
02.14.1 Groundwater Temperature 20 m Below Surface

The present map illustrates the groundwater temperature distribution for the reference horizon 20 m below the surface in the area of the “neutral zone”. At such depths, seasonal temperature fluctuations usually do not occur. 02.14.1 Groundwater Temperature 20 m Below Surface

Vorschau

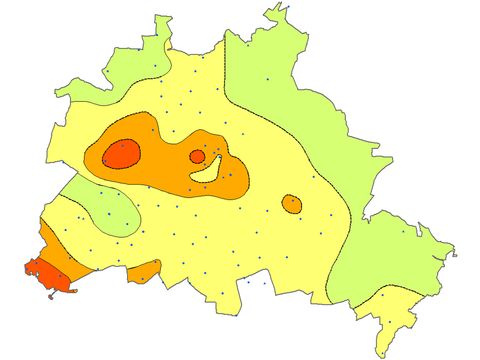
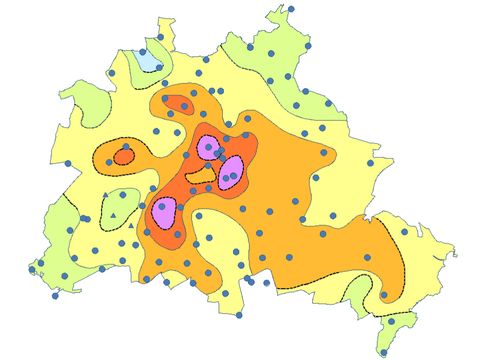
02.14.3 Groundwater Temperature 40 m Below Surface

The present map illustrates the groundwater temperature distribution for the reference horizon 40 m below the surface. At such depths, seasonal temperature fluctuations usually do not occur. The temperature distribution results presented here should not be understood as absolute numbers but rather as a trend. 02.14.3 Groundwater Temperature 40 m Below Surface

Vorschau

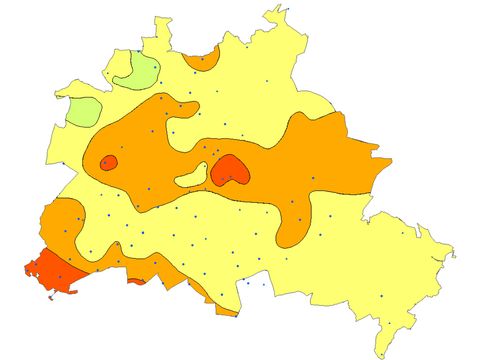
02.14.4 Groundwater Temperature 60 m Below Surface

The present map illustrates the groundwater temperature distribution for the reference horizon 60 m below the surface. At such depths, seasonal temperature fluctuations usually do not occur. The temperature distribution results presented here should not be understood as absolute numbers but rather as a trend. 02.14.4 Groundwater Temperature 60 m Below Surface

Vorschau

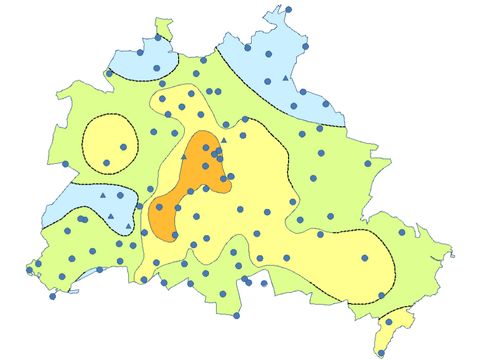
02.14.5 Groundwater Temperature 80 m Below Surface

The present map illustrates the groundwater temperature distribution for the reference horizon 80 m below the surface. At such depths, seasonal temperature fluctuations usually do not occur. The temperature distribution results presented here should not be understood as absolute numbers but rather as a trend. 02.14.5 Groundwater Temperature 80 m Below Surface

Vorschau

02.14.6 Groundwater Temperature 100 m Below Surface

The present map illustrates the groundwater temperature distribution for the reference horizon 100 m below the surface. At such depths, seasonal temperature fluctuations usually do occur. The temperature distribution results presented here should not be understood as absolute numbers but rather as a trend. 02.14.6 Groundwater Temperature 100 m Below Surface

Vorschau

02.14.7 Average Temperature of the Groundwater 0 m - 50 m below Terrain Surface

The map on the average temperatures for depths ranging from 0 to 50 m serves as a tool for estimating the specific performance of ground heat exchangers. It shows that especially the densely built-up inner city area has average temperatures of more than 11 °C. The outskirts exhibit average temperatures of around 10 °C. 02.14.7 Average Temperature of the Groundwater 0 m - 50 m below Terrain Surface

Vorschau

02.14.8 Average Temperature of the Groundwater 0 m - 100 m below Terrain Surface

The map on the average temperatures for depths ranging from 0 to 100 m serves as a tool for estimating the specific performance of ground heat exchangers. Average temperatures of approx. 12 °C occur in the inner city area and the immediately adjacent urban areas. In the outskirts, the average temperatures are between 10 °C and 11 °C. 02.14.8 Average Temperature of the Groundwater 0 m - 100 m below Terrain Surface