Traffic-related Emissions and Immissions 2016

Map Description

Scenario calculations on the effect of selected measures

The effect measures have on emissions and immission were modelled based on the trend prognosis for the year 2020 without the influence of measures. Measures for road traffic were selected with the goal of reducing NO2 pollution along roads.

Measures expected to lower emission throughout the city or for the majority of road sections exceeding the limit were investigated. Additionally, appropriate models for calculating the effect had to be available. For some measures, multiple scenarios were developed. Based on these, the scope of the measures required to be able to comply with the limits was thus estimated as were strategies on how to avoid inappropriate burdens. Some of the measures were developed in detail, e.g. those for parking management, regardless of whether they are actually suitable for modelling. This serves to ascertain the possible potential for reduction, first of all.

When a measure is included in the scenarios or in the selected area of implementation, this does not mean that the measure will definitely be part of the Clean Air Plan. Deciding factors include effectiveness, proportionality, affordability and the technical, legal and administrative feasibility.

Scenario 7 "Vehicle technology": – Retrofits on diesel vehicles

Improvements in vehicle technology are suitable for reducing pollutant emissions in the entire vehicle fleet. Lower emissions can be achieved by replacing vehicles with high pollutant emissions with low-emission vehicles. These include electric or electric hybrid vehicles, vehicles powered by natural gas or diesel vehicles with low real NOx emissions. A further measure to lower emissions is to retrofit existing vehicles with additional exhaust gas treatment systems (hardware retrofitting).

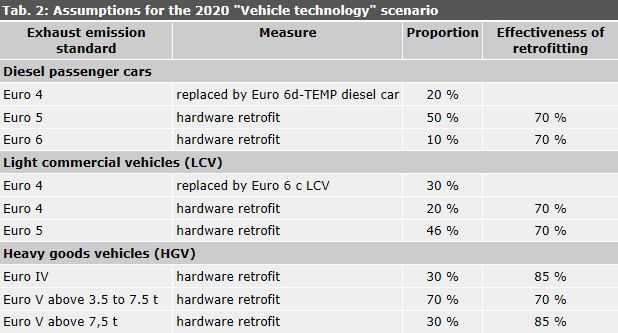
The "Vehicle technology" scenario is based on assumptions regarding vehicle replacement and hardware retrofitting, which are summarised in Table 2. As scenarios were calculated in autumn 2018, the requirements for hardware retrofitting of passenger cars and light commercial vehicles set by the BMVI (Federal Ministry of Transport and Digital Infrastructure) could not yet be considered. The "Technical requirements for nitrogen oxide (NOx) reduction systems with increased reduction performance for retrofits on passenger cars and similar vehicles (NOx reduction systems for passenger cars)" published by the BMVI on December 28, 2018 could therefore not be taken into account. These requirements do not stipulate a specific degree of effectiveness, but an emission value of 270 mg/km based on the average of what is called an RDE test drive. This involves measuring exhaust emissions in real road traffic (real driving emissions). The emission model used here is based on the emission factors of the Handbook Emission Factors for Road Transport (HBEFA) recommended by the Federal Environment Agency. Such specifications cannot be used for the model directly, however, as the HBEFA differentiates emission specifications according to traffic situations.

Based on the results of retrofits on Berlin’s public buses, 70 % was assumed as the level of effectiveness for retrofits on passenger cars and light commercial vehicles. For heavy goods vehicles weighing more than 7.5 t, the level of effectiveness applied was 85 %, according to the BMVI funding guidelines regarding retrofits on heavy municipal vehicles. No retrofits or replacements were assumed for buses for 2020, as the retrofitting of BVG buses was already included in the 2020 trend prognosis.

The assumed proportions of retrofitted vehicles yield correction factors for the HBEFA emission factors ranging from 0.51 to 0.93. This represents emission reductions between 7 % and 49 % for each vehicle group. Replacing Euro 4 diesel cars with Euro 6d-TEMP vehicles influences the representative proportions of the fleet regarding the emission analysis.

Table 2: Assumptions for the 2020 “Vehicle technology” scenario

Tab. 2: Assumptions for the 2020 “Vehicle technology” scenario

Calculation of emission

The same method used for calculating emissions for the prognosis year "2020 trend" was used here. Unlike in the trend prognosis, however, the software update was not taken into account, as it is currently impossible to estimate how software updates and hardware retrofits will be combined. This may lead to overestimations of emissions.

Emissions were calculated by sections, based on the adjusted fleet composition and the correction factors derived for the emission factors as a result of retrofitting.

Table 3 displays the emission results for motor vehicle traffic. It is based on the adjusted fleet for Berlin for the 2020 prognosis. It further presents the technology scenario for both the NOX total emission and the NO2 direct emission. Lastly, it presents emissions by vehicle type, also indicating the relative differences between the two calculations.

Table 3: Comparison of the annual emissions of the total motor vehicle traffic [t/a] and emissions by vehicle type for the 2020 trend prognosis and the technology

Tab. 3: Comparison of the annual emissions of the total motor vehicle traffic [t/a] and emissions by vehicle type for the 2020 trend prognosis and the technology

Based on the assumptions described above and by retrofitting and replacing older vehicles, NOx emissions from motor vehicles can be reduced by 405 t/a or 9.5 % in total. Furthermore, NO2 direct emissions are lowered by 137 t/a, which represents a reduction rate of 13.5 %. The highest decrease in NOx emissions are achieved for light commercial vehicles with 22.6 %, while NOx emissions from passenger cars decrease only by 7.6 %.

Effect on NO2 pollution along roads

The first step to calculate the total NO2 load of each road section is to determine the immission load in Berlin for the prognosis year 2020. For the "Vehicle technology" scenario, only the effect on local traffic emissions and thus the local additional load per section was determined. The existing load that is required to calculate the total load was adopted without change from the calculations for the prognosis year 2020. Lowered emissions caused by improved vehicle technology also affect the existing NO2 pollution in the urban background. The chosen method therefore tends to overestimate the total NO2 pollution.

In the "Vehicle technology" scenario, the NO2 immission along primary roads with critical NO2 levels, i.e. levels above 36 µg/m3, have been predicted to decrease by 1.9 µg/m3 on average for 2020 (trend prognosis), with a maximum decrease of 3.9 µg/m3 in Leipziger Straße and a minimum decrease of 1.0 µg/m3 in Turmstraße.

It is furthermore predicted for 2020, that the number of sections with an NO2 annual mean of above 36.0 µg/m3 will decrease from 117 sections, covering a total length of 14.6 km, to 78 sections with a length of 10.1 km.

The number of road sections whose NO2 annual mean exceeds 40 µg/m3 will drop from 31 to 17. The length of the affected sections will decrease from 3.5 to 1.7 km, representing about 1,800 people that are impacted by exceeded NO2 limits.

Scenario 5 und 6: "Promoting ecomobility"

With a shift from cars to ecological mobile transport options (local public transport, cycling and walking), emissions caused by motor vehicle traffic can be avoided. The aim of Berlin’s transport policy is to increase the share of the ecomobility. To this end, there are a variety of measures, ranging from infrastructure improvements to communication campaigns. Models, however, can only grasp the complexity of these measures to a very limited extent.

A number of selected measures were compiled, and assumptions were set regarding price incentives and effects on travel times to be able to calculate an Ecomobility scenario. Thus, the traffic model for Berlin was used to estimate the switch from cars to ecomobility and the resulting traffic volumes. These form the basis for calculating emissions and the additional NO2 pollution along primary roads.

The following assumptions were made for the Ecomobility scenario:

  • The price of a company ticket for public transport is lowered to 50 Euro.
  • Cycling is promoted by measures corresponding to an increase of bicycle traffic speed by 2 km/h.
  • Parking management is expanded, and fees are increased.

Two options were calculated for the Ecomobility scenario, which differ in relation to parking management. Option 1 assumes that 50 % of the area within the City Rail Circle Line is covered by parking management, without changing the parking fees ("PB 50"). Option 2 models a maximum scenario that assumes that the whole area within the City Rail Circle Line is dedicated to parking management, including parking fees of 3 Euro instead of previous fees of 1 to 3 Euro ("PB 100") per hour. The assumptions on public transport and bicycle traffic remained unchanged.

Calculation of emission

The same method used for calculating emissions for the prognosis year "2020 trend" without measures was used here (but incl. the software update). Emissions were calculated by sections, based on the altered traffic figures.

Table 4 compares the driving volume data for primary road network traffic volumes, as used in the emission calculation, with the driving volume predicted for 2020, also indicating relative differences. As ecomobility cannot include freight transport, there is no change for commercial vehicles.

According to our data, driving volume can be reduced by almost 10 % only with a complete parking management network and higher parking fees. The driving volume is lowered only by just under 2 % in the PB 50 scenario, on the other hand. This is the case despite measures promoting ecomobility.

Table 4: Motor vehicle driving volume for the scenarios promoting ecomobility compared with the 2020 trend prognosis

Tab. 4: Motor vehicle driving volume for the scenarios promoting ecomobility compared with the 2020 trend prognosis

Table 5 compares emission results for the scenarios promoting ecomobility with the emissions trend prognosis for 2020. In total, the "PB 50" option, i.e. the slight expansion of parking management, will reduce NOx emissions by approx. 1 % or 45 t/a across all primary roads. Only the "PB 100" option will result in more substantial emission reductions of around 6.5 % or 279 t/a.

Table 5: Emissions for the scenarios promoting ecomobility compared with the 2020 trend prognosis

Tab. 5: Emissions for the scenarios promoting ecomobility compared with the 2020 trend prognosis

Effect on NO2 pollution along roads

Based on the emissions of the local motor vehicle traffic, the additional local pollution was calculated for each road section. The existing pollution that is required to calculate the total pollution was adopted without change from the calculations for the prognosis year 2020.

For the "PB 50" option, the NO2 pollution along primary roads with critical NO2 levels, i.e. levels above 36 µg/m3 (in relation to the 2020 trend prognosis), have been predicted to decrease by 0.4 µg/m3 on average only, ranging from 0 to 1.5 µg/m3. The strongest decrease was calculated for Reinhardstraße.

Substantial improvements in air quality may be achieved with the "PB 100" option. The annual mean NO2 values are predicted to decrease by 0.5 to 4.2 µg/m3 with an average reduction of 2.3 µg/m3. The highest decrease was calculated for Lietzenburger Straße between Pfalzburger Straße and Uhlandstraße.

The number of road sections which exceed the NO2 annual mean of 40 µg/m3 is reduced from 36 to 34 sections for the "PB 50" option and to 32 sections for the "PB 100" option. This decreases the length of the affected sections from 3.9 to 3.8 and 2.2 kilometres respectively.

The number of sections with an NO2 annual mean of above 36 µg/m3 decreases from 124 sections covering a total length of 15.3 km to 114 sections covering a length of 14.1 km for the "PB 50" option of the 2020 trend prognosis; and the number of sections drops to 73 with a length of 8.8 km for the "PB 100" option.

Scenario 1 to 4: "Access restrictions for diesel vehicles"

As demonstrated by the impact studies for the different measures described above, these measures are not enough to ensure that all road sections comply with the NO2 limit swiftly.

Therefore, the effect of access restrictions for diesel vehicles on road sections was modelled for all sections with NO2 annual means above 40 µg/m3 predicted for 2020. Extensive driving bans or driving bans for sections that go beyond the requirements of the existing environmental zone were not investigated for petrol cars. According to the ruling of the Berliner Verwaltungsgericht (Administrative Court) of 9 October 2018, these are not required and excessive.

The following scenarios with varying levels of intervention were investigated for diesel driving bans for road sections:

Scenario 1:
Driving ban for diesel cars with Euro 5 and older emissions standards.
This affects 16.3 % of the passenger cars expected to be driven in Berlin in 2020.

Scenario 2:
Driving ban for all diesel vehicles excluding public buses and Euro 5 / V and older motorcycles.
In terms of the 2020 fleet, this involves:

  • 16.3 % of passenger cars,
  • 70.4 % of light commercial vehicles (<= 3.5 t),
  • 39.6 % of heavy goods vehicles (> 3.5 t) and
  • 51.9 % of coaches.

Scenario 3:
Driving ban for diesel cars with Euro 6c and older emissions standards.
This applies to 35.3 % of the passenger cars expected to be driven in Berlin in 2020.
(Diesel passenger cars of the Euro standard 6d-TEMP and 6d are excluded from the driving ban).

Scenario 4:
Driving ban for heavy goods vehicles (> 3.5 t) with Euro V or lower emissions standards.
This applies to 39.6 % of the heavy goods vehicles expected to be driven in Berlin in 2020.

The vehicles expected to be driven in Berlin in 2020 were calculated based on the 2014 vehicle fleet and the German fleet development expected until 2020.

A compliance rate of 80 % was assumed for all scenarios, i.e. 20 % of the vehicles affected by the driving ban continue to drive through sections with a driving ban. This is due both to exemptions as well as to non-compliance. This rate was adopted from models of other clean air plans (Stuttgart, Hamburg).

Table 6 lists road sections below which, according to our models, will still have NO2 levels of above 40.0 µg/m3 in 2020 and which have been investigated in regard to driving bans according to the four scenarios.

Table 6: All road sections for which the effect of driving bans has been established (including NO2 levels for 2020 according to the trend scenario without further measures)

Tab. 6: All road sections for which the effect of driving bans has been established (including NO2 levels for 2020 according to the trend scenario without further measures)

Effect on traffic

The effect of driving bans on traffic flows was established based on the Berlin traffic model and using traffic data from the 2020 trend prognosis. Both the shift of vehicles affected by the driving ban to alternative routes, and the shift of non-affected vehicles to freed-up slots of sections with driving bans were calculated.

Traffic flows of the entire network are divided into passenger cars and light commercial vehicles and heavy goods vehicles for each driving ban scenario. This approach considers sections in which the vehicles are still allowed to drive. For each route, the utilisation rate is indicated for low-emission vehicles that are not affected by driving bans as well as high-emission vehicles that are affected by driving bans.

In addition to changes in traffic flows on primary roads, effects on secondary roads were also investigated.

Overall, there are not only changes in traffic flows in the immediate vicinity of road sections with driving bans, but also large-scale changes in the road network due to long detours.

In all scenarios, the secondary network also sees increases in traffic volumes, which oppose efforts to calm traffic. For the majority of roads, the increase or decrease in traffic volumes lies between 25 and 250 vehicles per day. There are some roads, however, for which the changes exceed 500 vehicles per day. As regards the total volume of traffic per day, increases and decreases are generally well below 10 % per section.

Calculation of emissions

Emissions were determined for groups of vehicles that are and are not affected by the driving ban. These were investigated separately, considering the respective requirements for the fleet compositions set by the scenarios. The emissions determined separately for the two groups were added by sections to yield the total emission. Table 7 presents the emissions predicted for the 2020 forecast baseline and the four scenarios for selected sections (cf. Table 6). A substantial reduction in NOx emissions can be observed for the most part. Emissions decrease between 4.9 and 34.5 % on average, depending on the scenario.

For Scenario 1 (driving ban for diesel passenger cars only), NOx emissions decreases range between 7 to a solid 31 %, i.e. emissions decrease by 14 % on average. This applies to selected sections which exceed NO2 limits and for which the effect of driving bans has been determined. If the driving ban is extended to diesel passenger cars with Euro 6 a-c (Scenario 3), which do not have requirements regarding real emissions, the average emission reduction increases to a solid 18 % with a maximum emission reduction of 32 %. The number of vehicles affected by the driving ban in this scenario is more than double, however. Hence, there is greater capacity scope, which is taken up by permissible vehicles, including commercial vehicles. This means that for some road sections, such as Brückenstraße, there is a smaller decrease in emissions for Scenario 3 than for Scenario 1. Scenario 2, which is a driving ban for all Euro 5 diesel vehicles and older, has the greatest effect. Here, emission reductions lie between 22 % and 46 %, with an average decrease of 35 %. Scenario 4, involving driving bans only for Euro V commercial vehicles and older, results in substantially smaller decreases. In the Dorotheenstraße section, NOx emissions even increase slightly.

Table 7: Emission reductions resulting from driving bans (scenarios 1 to 4) on routes with NO2 annual means of above 40 µg/m³, according to the 2020 trend prognosis

Tab. 7: Emission reductions resulting from driving bans (scenarios 1 to 4) on routes with NO2 annual means of above 40 µg/m³, according to the 2020 trend prognosis

Effect on NO2 pollution along roads

The immission load along built-up roads in Berlin’s primary road network for 2020 (prognosis year) forms the basis for calculating the total pollution. For all four scenarios, the effect on the local additional pollution was determined for the section. The existing pollution required to calculate the total pollution was adopted without change from the calculations for 2020 (prognosis year).

Table 8 presents a summary of the results of the four calculated scenarios below.

Table 8: NO2 annual means [µg/m³] for the 2020 trend prognosis (routes with annual mean NO2 levels above 40 µg/m³) and driving ban scenarios 1-4

Tab. 8: NO2 annual means [µg/m³] for the 2020 trend prognosis (routes with annual mean NO2 levels above 40 µg/m³) and driving ban scenarios 1-4

The scenario with the greatest impact bans driving for all Euro 5 / V diesel vehicles and older (Scenario 2). All tested sections of the route comply with the NO2 limit of 40 µg/m3, except for Leipziger Straße.

On Leipziger Straße, NO2 annual means exceeding 60 µg/m3 can be reduced to 45.5 µg/m3 between Wilhelmstraße and the building of the Bundesrat, if the driving ban for Euro 5 / V diesel vehicles and older is applied. Also on Leipziger Straße, NO2 levels can be reduced from 55.6 µg/m3 to 41.7 µg/m3 between Charlottenstraße and Friedrichstraße. At the same time, however, diversion traffic increases the predicted NO2 annual mean on Invalidenstraße from 39.4 µg/m3 to 41.6 µg/m3, and on Turmstraße from 39.3 µg/m3 to 41.2 µg/m3. This means that the NO2 limit would be exceeded in those sections. From a legal perspective, the limit has been complied with if the determined annual mean lies below 40.5 µg/m3.

Driving bans of Euro 5 diesel passenger cars and older (Scenario 1) and of Euro 6c diesel passenger cars and older (Scenario 3) are not enough, however, to reliably keep NO2 values below the 40 µg/m3 limit in the case of 11 or 10 road sections respectively. Furthermore, it is evident that these driving bans cause a traffic shift to the surrounding roads. This means that for 5 to 8 road sections, NO2 values are predicted to exceed 40 µg/m3, which is not the case if there are no driving bans.

Compared to the other 3 driving ban scenarios, banning heavy goods vehicles above 3.5 tonnes with the Euro V standard or lower (Scenario 4) will reduce NO2 levels the least for sections where NO2 levels exceeding 40 µg/m3 have been predicted for 2020 (trend scenario). In addition, this driving ban would result in exceeding the NO2 annual mean of 40 µg/m3 at Invalidenstraße, as commercial vehicles affected by the driving ban would likely choose this detour.

Besides lower NO2 levels in roads with driving bans, diverted traffic leads to new exceedances of the annual limit of 40 µg/m3 in some roads. These sections are summarised in Table 9 below. Measures must also be taken to comply with the air quality limit for sections newly exceeding the limit.

Table 9: NO2 annual means [µg/m³] on road sections which show NO2 values above 40 µg/m³ for the first time, due to diverted traffic in scenarios 1-4

Tab. 9: NO2 annual means [µg/m³] on road sections which show NO2 values above 40 µg/m³ for the first time, due to diverted traffic in scenarios 1-4