Long-term Mean Precipitation Distribution 1991 - 2020

Map Description

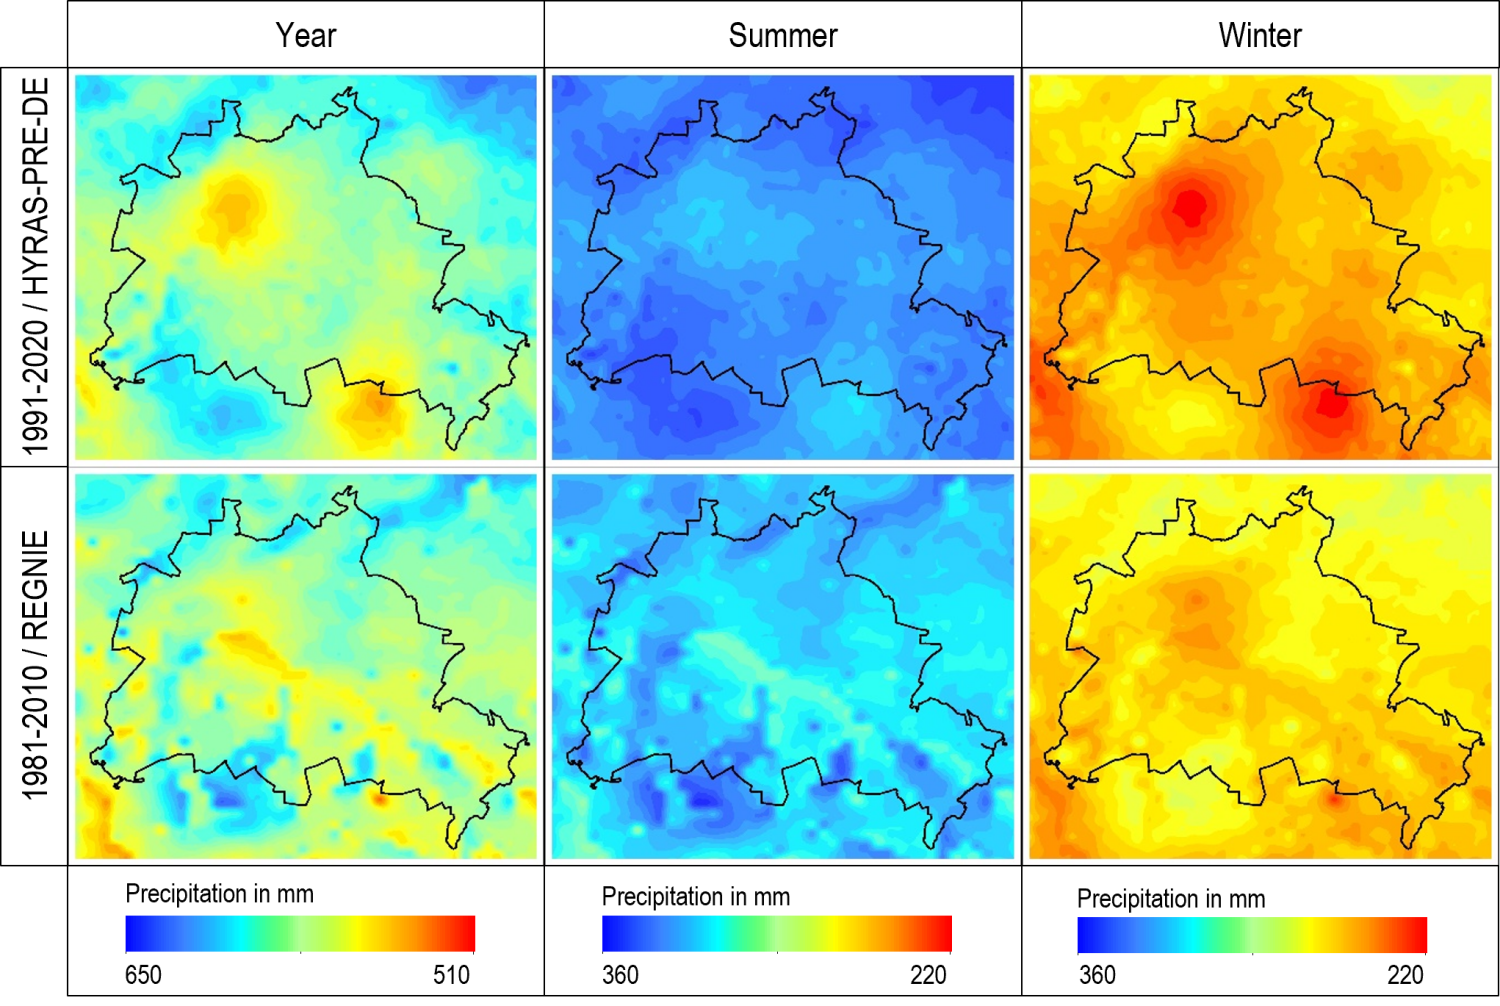
The maps present the total precipitation averaged over the period from 1991 to 2020 according to water years (hydrological years, discharge years). A water year ends in October of the year in its title; it begins, however, in November of the year prior to that. The evaluations for the water years from 1991 to 2020 thus refer to the period from November 1, 1990 to October 31, 2020.

In addition, the totals for the winter and summer halves of the water year are also presented. Table 1 displays the evaluation periods.

Tab. 1: Evaluation periods for the long-term mean precipitation distribution, 1991-2020
Map Evaluation period Month Period
04.08.1 Annual precipitation November – October Nov. 1980 – Oct. 2020
04.08.2 Summer half May – October May 1981 – Oct. 2020
04.08.3 Winter half November – May Nov. 1980 – May 2020

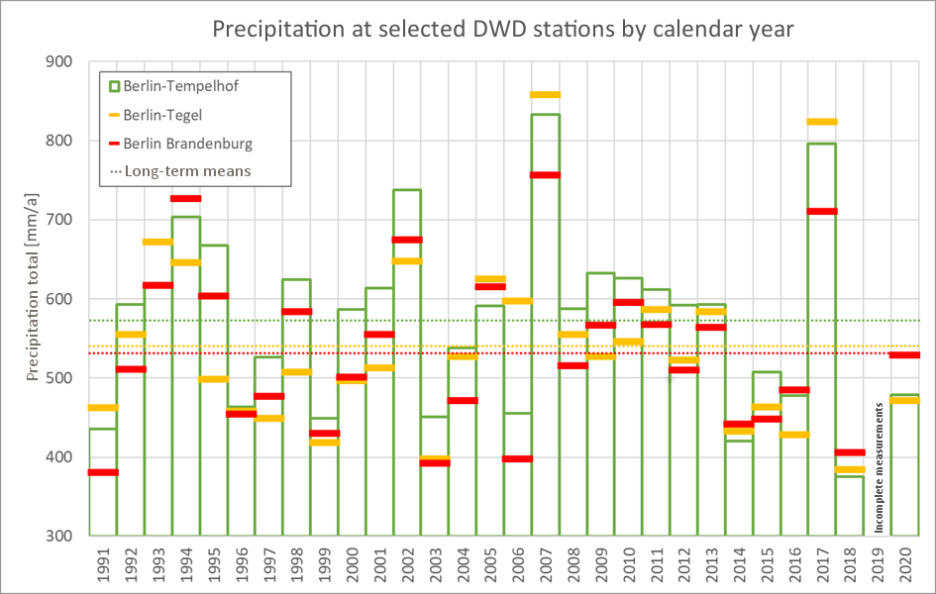
Berlin’s mean annual precipitation totals for the period from 1991 to 2020 range between 539 mm and 618 mm, depending on the location, the mean of which is 581 mm (cf. Table 2). The annual precipitation is generally distributed homogeneously across the city with only a few deviations. Areas around the former Berlin-Tegel Airport and Berlin Brandenburg Airport stand out in particular for being considerably drier. Both locations contain DWD precipitation stations. Here, the long-term mean precipitation is distinctly lower compared to other stations nearby (e.g. Berlin-Tempelhof). For example, the mean long-term precipitation for the period from 1991 to 2020 (calendar years) is 540 mm at the Berlin-Tegel station, 534 mm at the Berlin Brandenburg station and 572 mm at the Berlin-Tempelhof station (cf. Figure 4). Due to the regionalisation procedure, the local station measurements impact a larger area (cf. Figure 2). A meteorological or technical reason for the deviating precipitation totals could not be identified.

Fig. 4: Annual precipitation totals at the DWD stations Berlin-Tempelhof, Berlin-Tegel and Berlin Brandenburg between 1991 and 2020

Fig. 4: Annual precipitation totals at the DWD stations Berlin-Tempelhof, Berlin-Tegel and Berlin Brandenburg between 1991 and 2020

At some of Berlin’s elevations, the mean precipitation is higher than the national mean due to orographic effects. This is the case, for example, at the _Großer Müggelberg_ mountain (115 m) in the southeast, the _Schäferberg_ mountain (103.5 m) in the southwest and on the Barnim Plateau northeast of Berlin. Overall, the orographic effect has decreased noticeably, however, since the earlier evaluation of the period from 1981 to 2010, which was based on REGNIE data. The area of the Grunewald forest up to _Diedersdorfer Heide_ (heath in Brandenburg) south of Berlin as well as the forest between Henningsdorf (Brandenburg) and Berlin-Frohnau also measured precipitation totals above the mean. (Map 4.08.1, cf. Figure 6).

Overall, similar characteristics have been observed for the summer half (Map 04.08.2) and the winter half (Map 04.08.3) of the year. In the summer half, with an average of 335 mm, the mean precipitation is distinctly higher than in the winter half with an average of 246 mm.

A correlation between the prevailing wind direction distribution for the Berlin area and the influence of the city’s topography may be derived both for the distribution for the year as a whole and in relation to the two halves of the year.

Figure 5 (SenUVK 2019) presents the mean wind direction distribution at the DWD station in Berlin-Tempelhof for all four seasons, differentiated by wind speed. Westerly winds of maritime and sometimes humid air occur frequently throughout the year. During winter months, the influence of continental, often dry currents moving from the south to the east increases.

Fig. 5: Mean wind direction distribution at the Berlin-Tempelhof DWD station for all four seasons from 2011 to 2017, differentiated by wind speed

Fig. 5: Mean wind direction distribution at the Berlin-Tempelhof DWD station for all four seasons from 2011 to 2017, differentiated by wind speed

Fig. 6: Terrain elevations, Berlin (SenStadtUm 2010)

The map characteristics do not provide any evidence that urban development impacts upon the precipitation distribution, as has been indicated by studies (cf. Introduction). Berlin’s development is still rather homogeneous in regard to height. This means that, on the one hand, there have been no artificial alterations of the soil roughness locally, alterations that could cause relief rainfalls. If the latter do occur, however, these are locally confined and rather spontaneous events that appear to be negligible regarding the long-term mean.

Table 2 presents a selection of statistic characteristic values for the long-term precipitation distribution from 1991 to 2020 for the evaluation periods indicated. The evaluations refer to the area of Berlin excluding surrounding areas.

Tab. 2: Statistic characteristic values for the long-term precipitation distribution in Berlin, 1991-2020
Annual precipitation Summer half Winter half
Minimum [mm/a] 539 320 217
Maximum [mm/a] 618 352 270
Mean [mm/a] 581.3 335.0 246.3
Standard deviation [mm/a] 13.4 5.3 9.0

Comparing the evaluations for the years from 1991 to 2020 with the evaluations for the period from 1981 to 2010, all maps display clear differences in their precipitation distributions (cf. Figure 7). However, the statistical characteristic values for the mean annual precipitation remain almost the same. Regarding the two hydrological halves of the year, it is evident that the summer half of the year is wetter on average (approx. +14 mm), while the winter half appears to be drier on average (approx. -16 mm) in the current evaluation period (1991-2020) compared to the previous one (1981-2010). For the period between 1991 and 2020, the spatial variance of the mean precipitation decreases, i.e. is more homogenous, in the summer half of the year, while it increases in the winter half.

The question of whether these statistical differences are a result of a change in data processing due to HYRAS-DE-PRE (1991-2020) as compared to REGNIE (1981-2010), or, whether they are due to climatic differences that occurred in the more recent reference period was not investigated as part of this data evaluation.

Fig. 7: Comparison of precipitation distributions for the evaluation period between 1991 and 2020 based on HYRAS-DE-PRE, and between 1981 and 2010 based on REGNIE