In Berlin, 18,368 (3.0 %) out of a total of 604,865 buildings, including underground car parks without overlying buildings, have a greened roof area or greened partial roof areas of > 10 m2. In total, 400 ha of the roof areas are greened (3.9 %) (Table 1). A look at the map reveals a concentration of greened roof areas in Berlin’s inner city.
New
The Environmental Atlas maps are available in the new Map Application
Green Roofs 2016
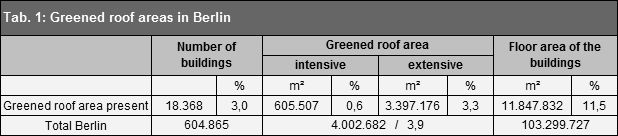
Tab. 1: Greened roof areas in Berlin
Image: Umweltatlas Berlin
Tab. 2: Distribution of the greened roof areas by building use (* Share of the greened roof area in the building floor area [%])
Image: Umweltatlas Berlin
![Fig. 3: Greened roof area [m²] - Proportion per building use class](/imgscale4/ropen/umweltatlas/_assets/nutzung/gruendaecher/en-abbildungen/ea611_03.gif)
Fig. 3: Greened roof area [m²] - Proportion per building use class
Image: Umweltatlas Berlin
Tab. 3: Distribution of the greened roof areas by area type of the ISU
Image: Umweltatlas Berlin
![Fig. 4: Greened roof area [m²] per borough disaggregated according to the greened proportion of roof area [%]](/imgscale4/ropen/umweltatlas/_assets/nutzung/gruendaecher/en-abbildungen/ea611_04.gif)
Fig. 4: Greened roof area [m²] per borough disaggregated according to the greened proportion of roof area [%]
Image: Umweltatlas Berlin
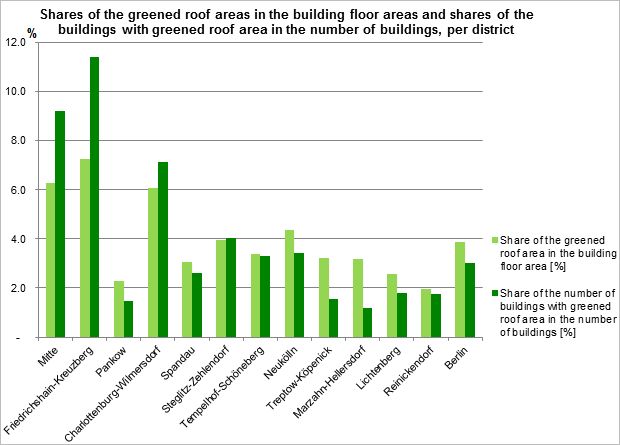
Fig. 5: Shares of the greened roof areas in the building floor areas and shares of the buildings with greened roof area in the number of buildings, per district
Image: Umweltatlas Berlin
![Fig. 6: Greened roof area [m²] per borough disaggregated according to intensive and extensive greening](/imgscale4/ropen/umweltatlas/_assets/nutzung/gruendaecher/en-abbildungen/ea611_06.gif)
Fig. 6: Greened roof area [m²] per borough disaggregated according to intensive and extensive greening
Image: Umweltatlas Berlin
Tab. 4: Distribution of the greened roof areas by borough (* Share of the greened roof area in the building floor area [%])
Image: Umweltatlas Berlin
Environmental Atlas Contact
Berlin Senate Department for Urban Development, Building and Housing
Mrs. Haag