Traffic-related Emissions and Immissions 2002

Map Description

Index of Air Pollution for PM10 and NO2 in 2002

Measurements of the concentration of pollutants are only representative for a limited area around the measuring location. Extensive calculation models were applied to the distribution of pollution in the city, together with the information garnered from the BLUME measuring locations to attain a complete picture. The calculation models are fully explained in the chapter Methodology in relation to street ravine weather conditions, together with traffic and emission data from 2002 which served as a base.

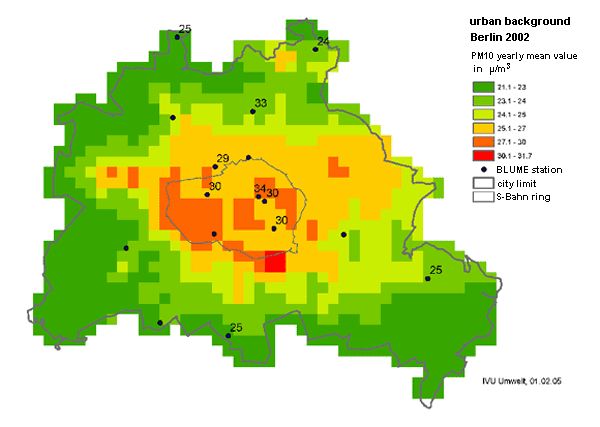
The urban background pollution from PM10 is illustrated in figure 9. Clearly there is a noticeable rise in the data from the outskirts of the city to the city center within the S-Train ring (large dog head).
The concentration between 25 and 32 µg/m3, calculated in the city center, represents pollution in residential areas with less traffic and at greater distances from industrial plants.

Fig. 9: PM10 pollution (annual average) calculated with IMMISnet and measured at BLUME measuring locations in the urban background of Berlin for the base year 2002

Fig. 9: PM10 pollution (annual average) calculated with IMMISnet and measured at BLUME measuring locations in the urban background of Berlin for the base year 2002

Based on the pollution distribution the calculations of PM10 and NO2 pollution emissions in the main street transit network was pursued as shown on the map. The calculation is completed through an extensive data display for each evaluated street section. It results from the overlay of the respective concentration in the urban background and the calculated additional pollution from local transit in respective sections of the main traffic streets. All red coloured street sections show excesses of the 24 hour limits for PM10 and / or the annual averages for NO2 from 2002 (compare table 2).
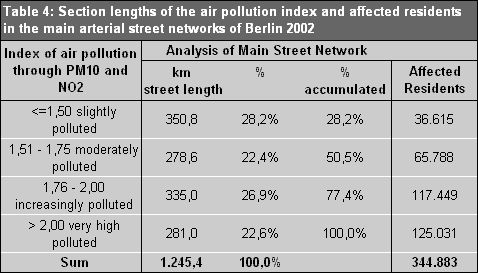
These sections are therefore classified as “very highly polluted” and require special attention to minimize near-surface air pollution in the future. The sections are distributed throughout the whole of the city, concentrated, however, in a ring formation around the city center, in the large arterial streets heading south and east, and the important connecting streets in the city such as the streets Bismarckstr./Kaiserdamm in Charlottenburg, the Tempelhofer Damm, including the southern extension, and the Frankfurter Allee or the Adlergestell in Köpenick. The overall length of the street sections adds up to approximately 281 km (= 23 % of the main arterial street system), where more than 125,000 people live (see table 4).

Those most affected live within the area of the so-called “large dog head” and along the arterial streets. The high pollution levels on the city freeway, which are clearly shown on the map, affect very few residents because the gap between the freeway and the houses is relatively large and the open space on the freeway allows the air to mix well.
The map also shows that a further quarter of all sections also exceed the index limit of 1.76 – 2.00. As well, this approximate 335 kilometre long section of the main street network can, at least in some parts, pose a problem in the future as usually also exceeds at least one parameter of the relevant limits.

Tab. 4: Section lengths of the air pollution index and affected residents in the main arterial street network of Berlin 2002

Tab. 4: Section lengths of the air pollution index and affected residents in the main arterial street network of Berlin 2002

The method applied to calculate the number of residents affected by limit excesses is taken from noise mapping (see also map 07.02 traffic noise (edition 2005)). The number of inhabitants whose residences front on the street is calculated. The number of citizens affected by limit excesses represents a rather conservative estimate, because pollutants spread everywhere and therefore increased concentrations can also be found outside of highly polluted street ravines.

Computed Trends for the Substances PM10 and Nitrogen Dioxide (NO2) for 2005 and 2010

In regard to long term compliance with air quality limits, the calculation of trend scenarios has significant value. They allow for the future development of large scale and local air pollution estimates and evaluation of whether the adopted measures must be strengthened in order to achieve a decline in air pollution. The emission readings for 2002, which form a basis for the calculation of air pollution indexes establish baselines. The resulting trend scenario takes into account both the 2005 and 2010 trend lines for e decreases in Europe and Germany, as well as in Berlin. They also show the progress achieved in the reduction of emissions from factories, power plants, and motor vehicles, as well as, for example, emissions of fine particulate matter from agricultural activity as a result of European regulations.
Due to the gradual replacement of older vehicles that have high pollution emissions, exhaust emissions (including nitrogen oxides and particles) from motor vehicle traffic will see a 30 % reduction by 2010. However, as traffic volume will increase, tire and brake friction, combined with the stirring up of street dust will increase the amount of fine particulate.

Compared to 2002 readings, 2010 total results for Berlin will see at least a 20 % reduction of NOx emissions and an approximate 6 % reduction of PM10.

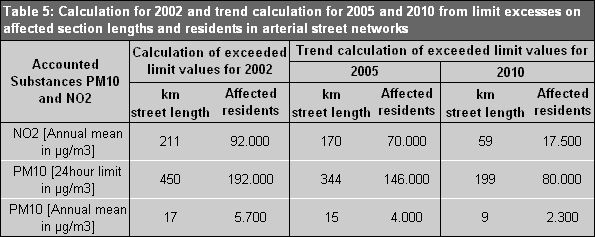
It can be predicted that, even in 2010, the 24 hour limits for PM10 on about 200 kilometres of main street networks will be exceeded, affecting approximately 80,000 residents (see table 5)). Thus, additional measures in Berlin on national and European scales must be taken to further reduce both components.

The concentrations in main traffic streets will be reduced by 2010 by 22 % on average due to the measures resulting from trend scenarios which have been introduced to date. Hence the number of streets with limit excesses, and the number of impacted residents are clearly reduced. In addition, Berlin’s specific measures are needed to relieve the remaining 59 kilometres of streets where 17,700 people live.

Tab. 5: Calculation for 2002 and trend calculations for 2005 and 2010 from limit excesses on affected section lengths and residents in arterial street networks.

Tab. 5: Calculation for 2002 and trend calculations for 2005 and 2010 from limit excesses on affected section lengths and residents in arterial street networks.

Summarised, it can be concluded that

  • on the action side, in Berlin for 2007, the prescribed limits for pollution output from industrial plants have already been achieved and are, in part, below limits;
  • the measures already implemented or introduced will lead to a 7 to 10 % reduction of fine particulate pollution and a 22% reduction of nitrogen dioxide emissions in the city’s residential areas; and
  • these decreases will suffice to meet the annual average fine particulate limit in years with adverse weather conditions. As well, by 2010 they will more than halve the length of street sections and affected citizens where the 24 hour limit for fine particulates and the annual limit for nitrogen dioxide are exceeded.

The additional possible measures and their effect on air quality is described in detail in the air monitoring and action plan for Berlin 2005-2010, passed by the Berliner Senate in August 2005.