The Environmental Atlas maps are available in the new Map Application
Long-term Development of Selected Climate Parameters 2013
Berlin-Tempelhof
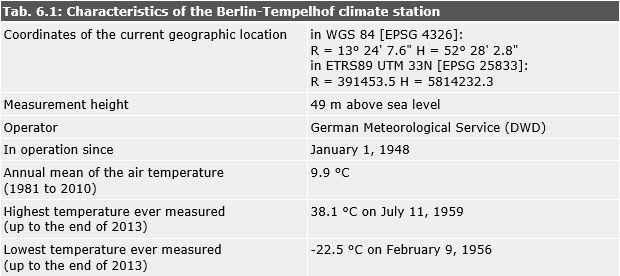
Tab. 6.1: Characteristics of the Berlin-Tempelhof climate station
Image: Umweltatlas Berlin
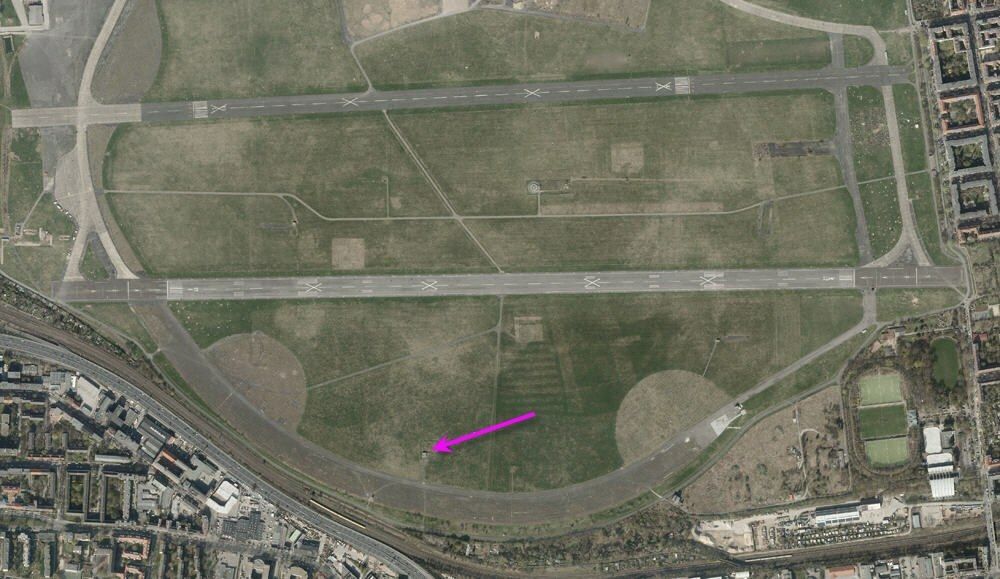
Photo 6.1: Location of the Berlin-Tempelhof station (see arrow mark).
Image: SenStadtUm 2014
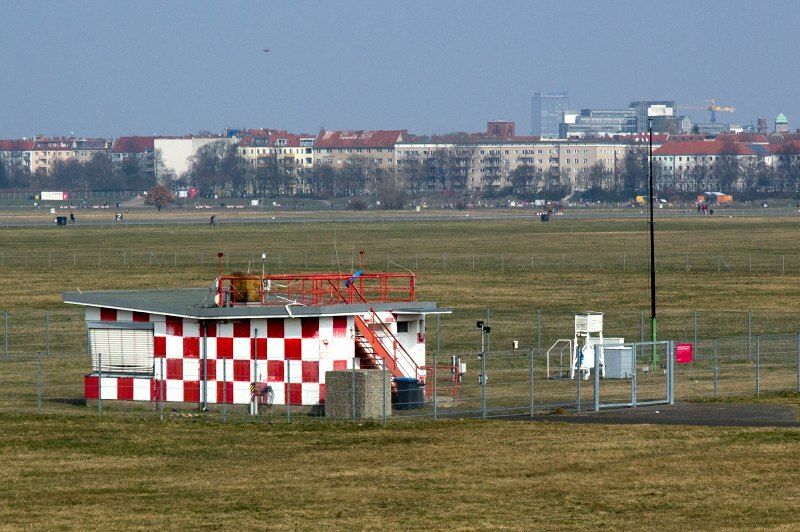
Photo 6.2: View of the Berlin-Tempelhof station
Image: Andreas Machate
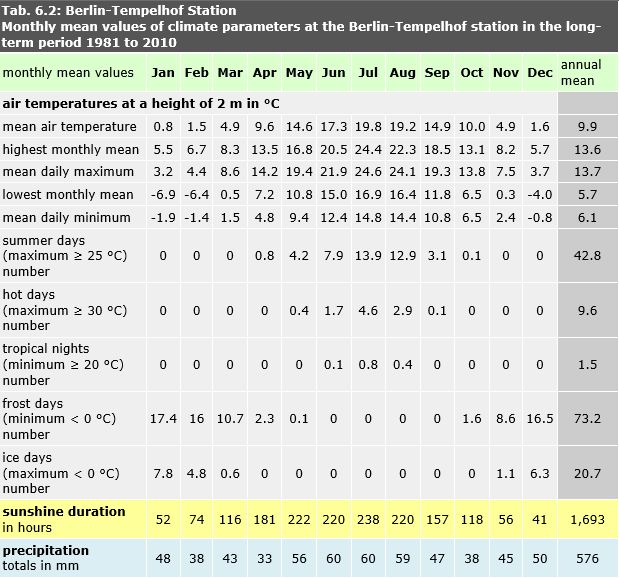
Tab. 6.2: Monthly mean values of climate parameters at the Berlin-Tempelhof station in the long-term period 1981 to 2010
Image: statistical base DWD, processing GEO-NET 2014
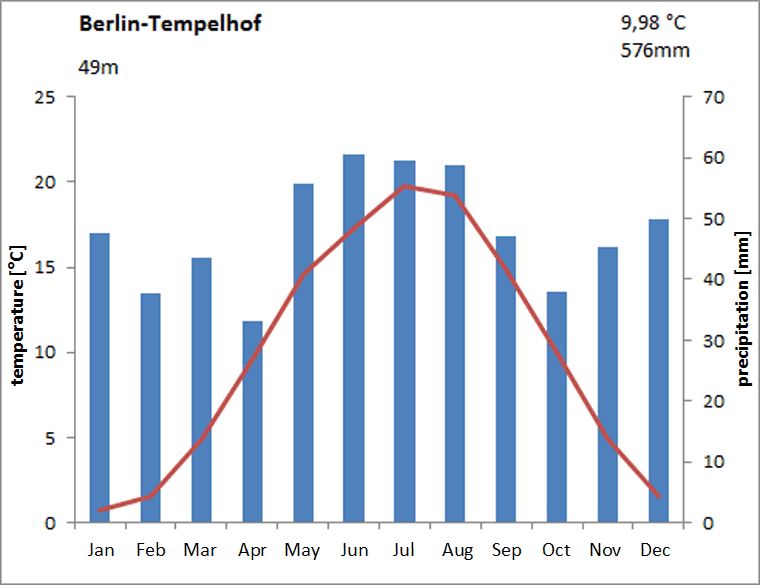
Fig. 6.1: Climate diagram for the Berlin-Tempelhof station for the long-term period 1981 to 2010
Image: GEO-NET 2014, Knerr 2014
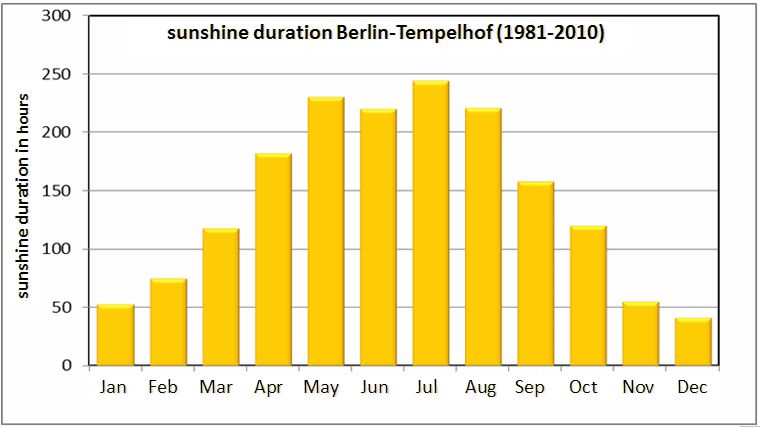
Fig. 6.2: Mean monthly sunshine duration at the Berlin-Tempelhof climate station for the long-term period 1981 to 2010
Image: statistical base DWD, processing GEO-NET 2014
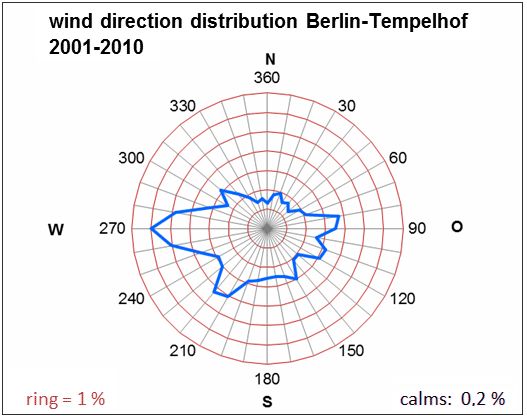
Fig. 6.3: Mean wind direction distribution in the period 2001 to 2010 at the Berlin-Tempelhof climate station (measurement height 10 m). The ring lines indicate the frequencies of occurrence of the wind directions, their distance corresponds to 1 %
Image: statistical base DWD, processing GEO-NET 2014
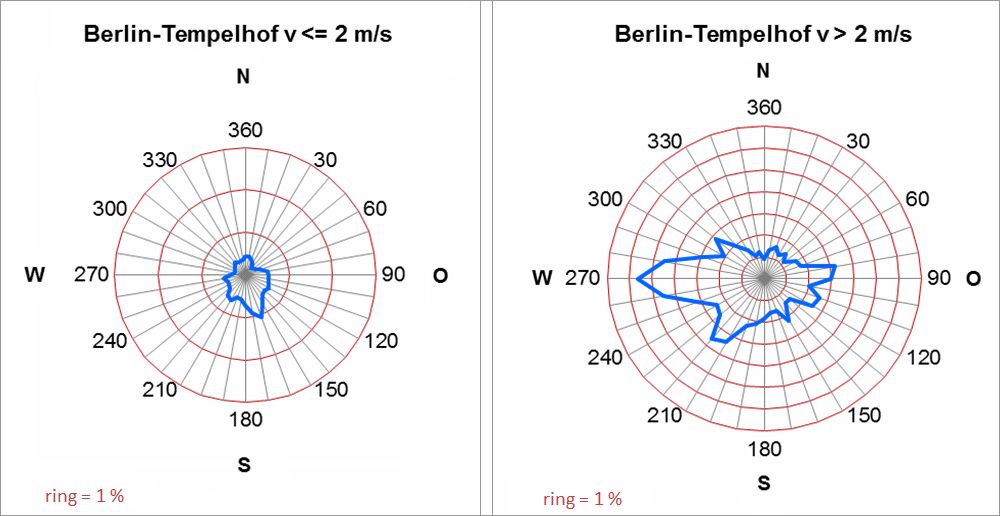
Fig. 6.4: Frequencies of the wind directions in the annual mean for the period 2001-2010 at the Berlin-Tempelhof climate station by wind speed (measurement height 10 m). The ring lines indicate the frequencies of occurrence of the wind directions, their distance corresponds to 1 %
Image: statistical base DWD, processing GEO-NET 2014
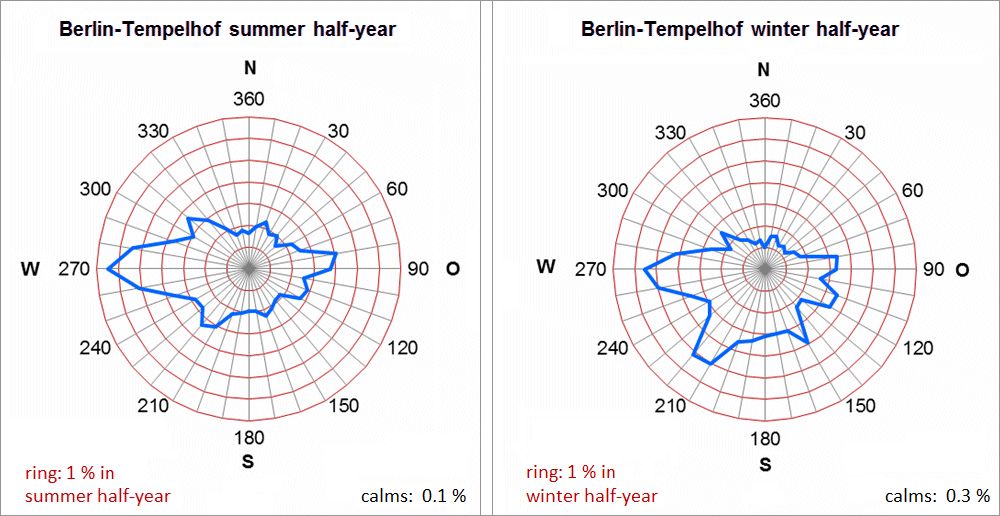
Fig. 6.5: Mean frequencies of the wind directions in the summer and winter half-years of the period 2001-2010 at the Berlin-Tempelhof climate station (measurement height 10 m). The ring lines indicate the frequencies of occurrence of the wind directions, their distance corresponds to 1 %
Image: statistical base DWD, processing GEO-NET 2014
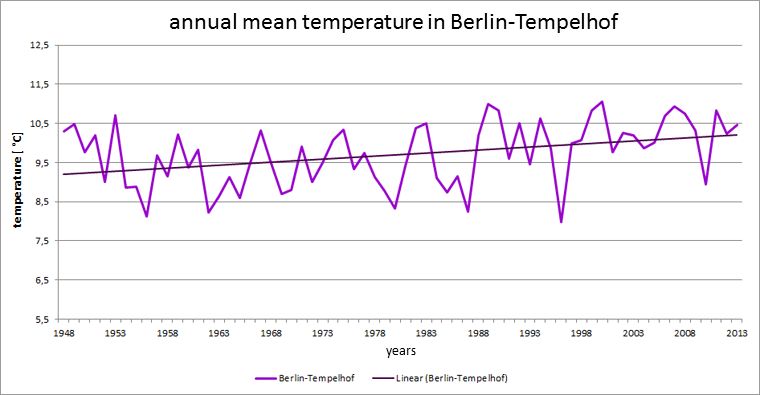
Fig. 6.6: History of the annual mean temperature at the Berlin-Tempelhof site in the measurement period 1948 into 2013
Image: GEO-NET 2014, Knerr 2014
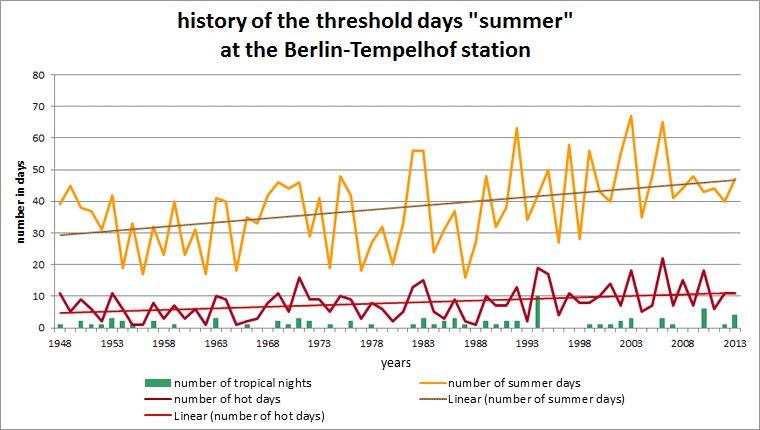
Fig. 6.7: History of the threshold days summer day, hot day and tropical night at the Berlin-Tempelhof station in the measurement period 1948 to 2013
Image: GEO-NET 2014, Knerr 2014
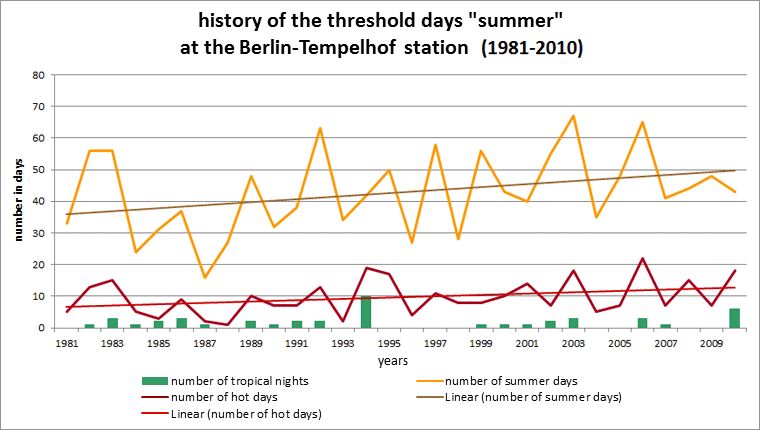
Fig. 6.8: History of the threshold days summer day, hot day and tropical night at the Berlin-Tempelhof station for the long-term period 1981 to 2010
Image: GEO-NET 2014, Knerr 2014
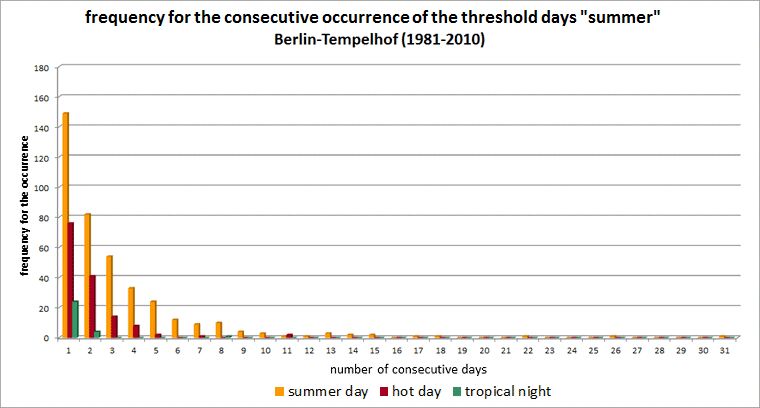
Fig. 6.9: Frequency of occurrence of consecutive summer days, hot days and tropical nights for the long-term period 1981 to 2010 at the Berlin-Tempelhof station
Image: GEO-NET 2014, Knerr 2014
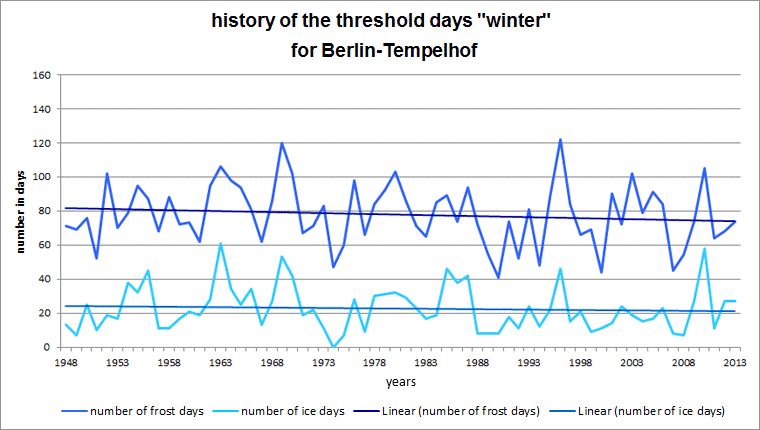
Fig. 6.10: History of the threshold days frost day and ice day at the Berlin-Tempelhof station in the measurement period 1948 to 2013
Image: GEO-NET 2014, Knerr 2014
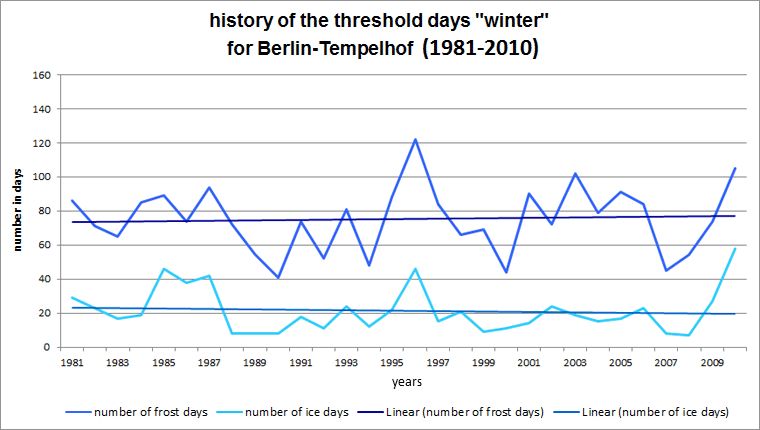
Fig. 6.11: History of the threshold days frost day and ice day at the Berlin-Tempelhof station for the long-term period 1981 to 2010
Image: GEO-NET 2014, Knerr 2014
Environmental Atlas Contact
Berlin Senate Department for Urban Development, Building and Housing
Mrs. Haag