The distribution of precipitation depends basically on different prevailing wind directions in different seasons, (cf. Fig. 4 and Map 04.03, SenStadtUm 1994b) as well as natural and anthropogenic orographical conditions. The relatively low levels of precipitation in the Berlin area at all points in time is also meaningful. This initial condition worsens related situations, such as groundwater. Groundwater recharge is hindered. "Losses" of precipitation occur through evaporation and surface drainage before precipitation can percolate into the ground (cf. Map 04.08.4). Some precipitation values should clarify the Berlin situation (cf. Fig. 3).
New
The Environmental Atlas maps are available in the new Map Application
Long-term Precipitation Distribution 1961 - 1990
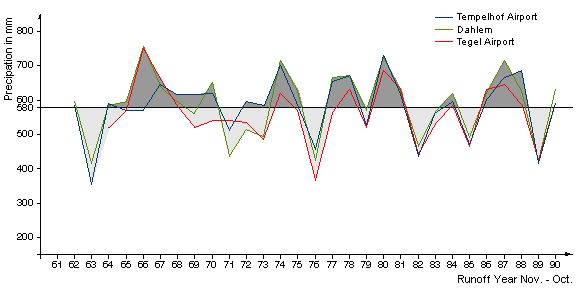
Fig. 3: Deviations in Annual Precipitation from Long-term Averages at the Stations Tegel Airport, Tempelhof Airport, and Dahlem between 1961 - 1990
Image: cf. Deutscher Wetterdienst 1994 and Schlaak 1991
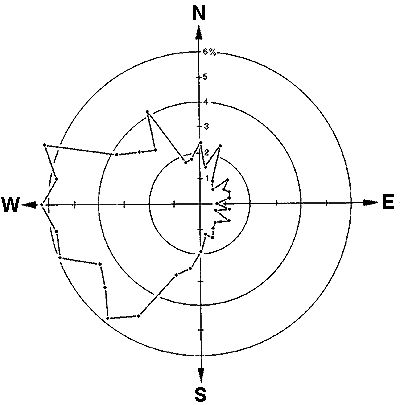
Fig. 4: Precipitation Quantities per 10° Sector of the Wind Rose in %, Reference Base: 597 mm per Year
Image: Institute for Meteorology, FU Berlin 1973 - 1982, from: SenStadtUm 1991
Environmental Atlas Contact
Berlin Senate Department for Urban Development, Building and Housing
Mrs. Haag