Quality of Near-surface Groundwater 2000

Methodology

Selection of indicators

About 150 parameters from all of Berlin were assessed within the context of a comprehensive statistical analysis of all measured data that were made available by the basic measuring network. In general, the nitrate contents of Berlin’s groundwater do not pose a problem. Organic trace constituents, including pesticides and heavy metals, are only detectable at a few measuring sites and in clearly limited places. This statement is based on the view that, according to current knowledge, these Berlin point sources do not cause an area-wide impairment of the groundwater bodies. When parameters were selected for a more comprehensive analysis, only those known to represent potentially problematic substances in Berlin’s groundwater were taken into account. Table I shows the relevant parameters for an area-wide chemical characterisation of Berlin’s groundwater together with information on the number of measured values, based on the selection of measuring sites and broken down according to the location of the measuring sites.

Tab. 1: Number of measured values provided by selected measuring sites, broken down by parameters and origin

Tab. 1: Number of measured values provided by selected measuring sites, broken down by parameters and origin

h6. *: incl. data from “Altdaten” [old data] and “Großprojekt” [large-scale project]

Once the data highlighting the condition had been analysed and corrected, the arithmetic mean values per measuring site were calculated. They constitute the direct database for the regionalised representation of the groundwater condition (expansion of point data to area data).

Interval limits

Six classes were formed in the course the differentiated statistical analysis of the measured values to permit a differentiated area-wide representation of concentration ranges. Table 2 includes the percentile distribution and the threshold limits. For boron the threshold limit of 1 mg/litre, which is also stipulated in the Drinking Water Ordinance (TrinkWV), is far above the values measured in Berlin’s groundwater. For this reason the value was adjusted to the data set and the threshold value was fixed to half the limiting value given in the TrinkWV (500 µg/l).

Tab. 2: Classification based on percentiles of the measuring network operated by the Senate in the main aquifer

Tab. 2: Classification based on percentiles of the measuring network operated by the Senate in the main aquifer

Once Table 2 had been analysed, classification into six-level intervals according to Table 3 was made for an initial assessment of the area-wide distribution of potential pollution parameters. The main purpose of this fine gradation is to get a better spatial representation of focal areas as the basis for a more differentiated comparison with land-use data. In addition, it allows a better assessment of high-pollution areas. The ranges of lower than half a threshold value, half a threshold value to threshold value and larger than the threshold value are important for the initial assessment of findings. The graduated breakdown into six ranges was adjusted as follows:

Tab. 3: Limits of intervals for the presentation of concentrations or the probability of exceeding them

Tab. 3: Limits of intervals for the presentation of concentrations or the probability of exceeding them

h6. The figures in bold type represent the threshold values laid down in the Drinking Water Ordinance

Description

For regionalisation purposes, the kriging estimate, which is based on weighted means of variable values, was chosen as the geostatistical approach. Measurements performed in selected places (groundwater measuring sites) are used for the continuous, area-wide determination of a parameter with spatial distribution. To move from the „point to the area“, i.e. to obtain data for the area-wide distribution of the parameter, the information derived from point measurements must be subjected to spatial interpretation. But a variable may take a different value in each place in space. Hence it is often impossible to provide a complete description of this variability. However, in most cases it is not random, but shaped by a certain spatial continuity. It is noticed that measured values from adjacent points show greater similarity than those that are more apart. “Ordinary kriging” (referred to as “OK”) was chosen from the large number of available kriging 
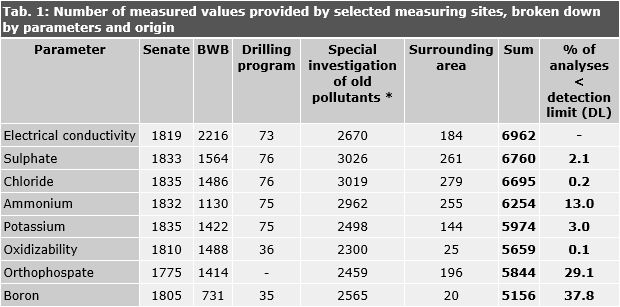
estimates for the parameters electrical conductivity, sulphate, chloride, potassium, oxidizability and boron. As a result of the spatial analysis performed for each chosen estimated point within a grid, this technique, which is also known as “ordinary” kriging, furnishes a concentration expressed in the respective absolute unit of measurement of the hydrochemical parameter in question. That was the aim of the investigation.

“Indicator kriging“ (referred to as „IK“) was conducted for the parameters ammonium and orthophosphate, since the variogram analysis did not show the measured values of these parameters to be spatially interrelated. Unlike OK, the measured values are not directly used for the indicator kriging approach, but are converted into binary codes (0 and 1), depending on the threshold to be determined. The result of IK provides information on the probability of exceeding the threshold. A value of 75% means, for example, that there exists a 75% probability of the threshold being exceeded in a given area. These codes are then used in the kriging estimate in the same way as OK, thus permitting an assessment for the area. The indicator kriging approach is applied if the proportion of measured values below the respective detection limit is relatively great. This is the case for the parameters ammonium, orthophosphate and boron. However, since the variogram analysis of the original measured values for the parameter boron showed a correlation that could be interpreted as a function of the distance, preference was given to interpolation according to the OK approach.