Traffic-related Emissions and Immissions 2010

Abstract

Reason

In the context of the new Clean Air Plan for 2011-2017 scenarios were calculated on the air-quaility effect of selected measures. The maps of air pollution on major roads drafted for the Clean Air Plan are to be made accessible online, so that it will be possible to access any section of the main road network for traffic volume, emissions, and air pollution in status quo, and taking into account the effects of certain packages of measures.

As exhaustive documentation of all essential contents of the new Clean Air Plan is available on the Internet, so that we will here indicate only several of the most important contexts.

Air Quality

Air quality has improved considerably in Berlin in recent years; however, especially during unfavourable meteorological situations, air pollution conditions may occur which endanger the health of Berlin’s people.
In Berlin, motor vehicle traffic has for some years been a major cause not only of noise pollution (see also Maps 07.05.1 and 2 Strategic Noise Maps, Road Traffic (2008 Edition)), but also of air pollution in important problem areas, especially since the shares of other air pollution sources in Berlin have been considerably reduced. As a result, many ambitious European air quality levels have already been met in Berlin (cf. also Map 03.12 Long-Term Development of Air Quality).

Nonetheless, for some pollutants, the ascertained concentration values in the near-ground air are still above the established limits for certain pollutants, at least some of the time. As a result, supplemental measures will have to be taken in future as well, in order to be able to stay below these limits permanently, as legally required under the Federal Immission Law (§ 47 BImSchG) and the § 27 of the 39th Federal Immission Ordinance (BImSchV).

Immissions prognoses, 2015-2020, given no additional measures (trend)

For clean air planning, it is first of all necessary to know what the future development of air quality without additional measures will be. For only on this basis can additional measures be determined in the necessary scale, which will be appropriate to the source, proportional and effective. By 2015, according to the plan, it was to become mandatory to comply with the nitrogen dioxide limit, even with a deadline extension, and 2020 was seen as the long-term perspective. While the clean air plan incorporates all relevant source groups, with an analysis of causes, a trend prognosis and the investigation of possible measures, the cartographic statements shown here concentrate on the main sources of near-ground air pollution, motor vehicle traffic.

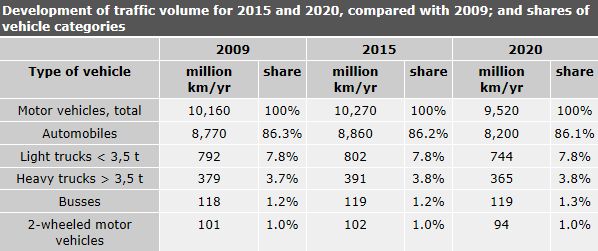
For the development of the volume of motor vehicle traffic, the Berlin Overall Traffic Prognosis 2025 was adapted for the prognosis years in the Clean Air Plan. This included adaptation of the data on demographic development, employment data, school attendance, retail space and infrastructural change, such as the state of parking space management. For the development of traffic costs, corrected for inflation, no increase was assumed.

For the prognosis year 2015, the following developments were taken into account:

  • The opening of the Berlin Brandenburg airport in Schönefeld
  • The closing of Tegel Airport
  • The construction of new road connections, such as the South-east Connector (Spree crossing), or the expansion of the A-10 motorway in Northern Berlin
  • Changes in traffic organization and street deconstruction (e.g. the deconstruction of the eastern segment of Invalidenstraße, or of Adlergestell.

For the prognosis year 2020, the infrastructural change included in the model was the construction of the extension of the A-100 motorway from the Neukölln interchange to Treptow.

The traffic volumes foreseen for 2015 and 2020 are shown in Table 1, broken down by vehicle category.

The results of these trend calculations of the emissions and immissions of motor vehicle traffic at various times of the year, calculated on the basis of the mentioned assumptions and the traffic count carried out in 2009, are shown in separate Environmental Atlas maps, 3.11.1 Traffic Related Air Pollution, and 03.11.2 Traffic Related Air Pollution by NO2 and PM10.

Tab. 1: Development of traffic volume for 2015 and 2020, compared with 2009; and shares of vehicle categories

Tab. 1: Development of traffic volume for 2015 and 2020, compared with 2009; and shares of vehicle categories

Scenario calculations on the effect of selected measures

The present 2011-2017 Clean Air Plan is an update of the previous Clean Air and Action Plan for Berlin, 2005-2010. Based on the new evaluation of air quality, trend prognoses for the years 2015 and 2020, and an analysis of the causes of higher air pollution, a package of five different measures has been developed to reduce immission pollutions along roads. These encompass both the continuation of numerous already operative measures, and additional new measures for reducing pollutant emissions and for improving air quality.

It is necessary to distinguish between the two most relevant pollutants, nitrogen dioxide (NO2) and particulate matter (PM10). Measures for reducing NO2 pollution are concentrated entirely on the traffic sector. In the case of particulate emissions reduction, by contrast, the large variety of sources requires taking a number of different measures in various areas, although the measures in the traffic sector continued to be very significant. This is particularly true with regard to the further reduction of diesel soot particles, since these are the cause of a particularly grave threat to human health.

The following table gives an overview of the packages of measures being considered, and the particular measures they contain:

Tab. 2: Scope of the five-measure package for scenario calculations in the motor vehicle traffic area

Tab. 2: Scope of the five-measure package for scenario calculations in the motor vehicle traffic area

We will here refrain from any detailed definition and description of the measures, and refer to the detailed descriptions in the Clean Air Plan, 2011-2017.

Generally, those measures which are likely to have an emissions reducing effect citywide, or at least for a major share of road sections where pollution limits are exceeded, were selected as a priority. Moreover, suitable models for the calculation of the effect need to be available.
Some of the measures have been formulated very comprehensively, independent of the concrete implement ability of the model, e.g., in the demand for a complete ban on the combustion of solid fuels in small firing plants, or the equipment of all construction machines with particulate filters. The reason for this was to start by scoping out the maximum possible reduction potential. Figure 1 demonstrates the effectiveness of various measures on truck emissions in Berlin compared with the train scenario for 2015.

Fig. 1: The effect of various measures on truck emissions in Berlin, compared to the trend scenario for 2015

Fig. 1: The effect of various measures on truck emissions in Berlin, compared to the trend scenario for 2015

A further reduction in traffic caused emissions is to be achieved by such measures as further improvement in vehicle technology (equipment with particulate filters and NOx-reduction systems, promotion of clean vehicles, fewer exceptions in the Environmental Zone, further optimization of traffic flows, speed limits adapted to conditions, logistics concepts, and the shifting of larger shares of the traffic volume to the environmentally friendly segments pedestrian traffic, bicycle traffic and public transport.

For the purpose of reducing particulate matter emissions, measures include not only the equipment of construction machinery and stationary industrial motors with particulate filters, and the reduction of emissions from solid fuel firing (e.g. wood-burning), but also such climate protection measures as the reduction of the heat requirement of buildings and the use of ambitious environmental standards for small block-scale cogeneration plants, in order to reduce air pollution.

In order to scope out the maximum reduction potential, the model calculations made very far-reaching assumptions, such as e.g. the complete reduction of all traffic backups on major roads, a relatively high share of electro-vehicles, or a complete reduction of all particulate emissions from the combustion of coal and wood in small firing plants. In practice, this will usually only be partially attainable. However, even with such far-reaching assumptions, the limits for particulate matter would not be achieved, either in 2015 nor in 2020, since previous pollution levels are so high that the additional reduction levels achieved in Berlin will not be sufficient. What is achievable is a reduction by up to approx. 60 % of the number of residents affected by transgressions of the limits, if the measures are fully implemented, although some 5000 people will continue to be affected (cf. Figure 2).

Fig. 2: Length of road segments with transgression of PM 10 limits (annual mean: > 32 µg/cu m), and the number of affected residents for the trend development and the implementation of the package of measures in 2015

Fig. 2: Length of road segments with transgression of PM 10 limits (annual mean: > 32 µg/cu m), and the number of affected residents for the trend development and the implementation of the package of measures in 2015

Amongst the various measures taken in the traffic sector, it is the reduction in driving speed due to the 30 km/h speed limit on street segments in which limits are exceeded – although the traffic flow remained constant – which has had the greatest effect, since it has also caused a reduction in the re-suspension of particulate matter.
Also of interest is the potential for reducing pollution by reducing the particulate emissions of all solid fuel firing, e.g. wood burning, as well as particulate reduction by means of certain filters in construction machinery. Overall, a reduction in numbers of affected persons by about 40% is forecast, although the data situation on emissions from these sources involves much greater uncertainties than the calculation of emissions of road traffic. Here, further investigations are necessary, and have in some cases already been initiated, such as the model projects on testing particulate filter equipment for construction machinery.

The limit for nitrogen dioxide cannot be achieved by 2015 by means of the measures which can be implemented in Berlin, although reduction of the number of affected people by about 40 % is possible. The only possibility for compliance with these limits would be if the share of vehicles with the exhaust emissions standards Euro 6 which is currently assumed for 2020 were already to be achieved in 2015. By 2020, it will be possible to comply with the limits without additional measures (cf. Figure 3).

Fig. 3: Length of road segments with transgressions of the NO2 limit, and numbers of affected residents, in the trend development and given implementation of the package of measures for 2015

Fig. 3: Length of road segments with transgressions of the NO2 limit, and numbers of affected residents, in the trend development and given implementation of the package of measures for 2015

An expansion of the Environment Zone, or the introduction of a third subzone with further reaching traffic restrictions, is, by contrast, not part of the Clean Air Plan, since it would be either unnecessary or else legally impossible and disproportionate.