Actual Use of Built-up Areas / Inventory of Green and Open Spaces 2005

Map Description

Map 06.01 ”Actual Use of Built-Up Areas”

Map 06.01 “Actual Use of Built-up Areas” shows the different use categories by their shares of the built-up area of Berlin and their distribution throughout the city area (status 2005-12-31). Figure 1 elucidates the distribution of the use shares further.

Fig. 1: Shares of the Various Use Categories of the Total Built-Up Area of Berlin, height of areas based on ISU5, segment block map

Fig. 1: Shares of the Various Use Categories of the Total Built-Up Area of Berlin, height of areas based on ISU5, segment block map

More than the half of the built-up area of Berlin is used for housing. Small-Business and Industrial Areas and Public Facilities account for 12% and 16%, respectively – still a relatively large part of the built-up area of Berlin. The Traffic Areas are next, without the roadways, which are not shown as traffic areas, with 7%, and then the Mixed Areas I and II with together 6%. Very little space is taken up by the Core Areas, Utilities Areas, Traffic Areas, Weekend Cottage Areas and Construction Sites.

Compared to the edition 2004 appears an increase of the portions of traffic areas, small business and industrial areas meanwhile the portions of building sites decreased as a result of the completion of many building projects (from 1.2 % including weekend cottages to 0.6 %).

In the distribution of the use categories of the built-up areas within the urban area, characteristic structures can be recognized. Thus, purely residential and small business areas exist in the outskirts area much more frequently than within the City Rail Circle Line; the Mixed and Core Area use categories are more heavily represented there. Particularly, Small Business Areas are concentrated along from waterways and railroad lines, due to the more favorable transport conditions. One often finds Mixed Areas and scattered Core Areas in the old village centers in the different parts of town, as a consequence of the well-developed structures. Striking is the concentration of the Core Areas in both city center areas, of West and East Berlin, i.e., around Kurfuerstendamm / Tauentzienstrasse and around the area of Alexanderplatz / Friedrichsstrasse, respectively. Public Facilities Areas are distributed throughout the entire urban area relatively evenly. Utilities Areas occur mainly in the outskirts, frequently in the neighborhood of Small Business Areas.

The described structures are also reflected in a comparison of the distribution of the land use categories within the individual boroughs (cf. Fig. 2).

Fig. 2: Proportions of Selected Use Categories in the Built-Up Areas of All Berlin Boroughs based on ISU5, segment block map

Fig. 2: Proportions of Selected Use Categories in the Built-Up Areas of All Berlin Boroughs based on ISU5, segment block map 1) value of area exists, percentage value = zero because of truncation (see statistical base)

Examples for the characteristic use distribution in the outskirts area are the boroughs of Marzahn-Hellersdorf and Reinickendorf, with 63 % and 60 % residential use and 13 % and 10 % industrial use, respectively, while in the borough of Mitte, with only 32 % Residential Areas, but 6 % Core Area use, 14 % Mixed Area use and a high share of Public Facilities (31 %), the central functions which have existed for centuries are reflected. This function is not shown so clearly for the West Berlin center around Kurfuerstendamm / Tauentzienstrasse, which has a Core Area share of only 2 % or less, since the core area is distributed among the three boroughs of Charlottenburg-Wilmersdorf, Mitte and Schoeneberg-Tempelhof.
The inner city boroughs of Friedrichshain-Kreuzberg and Charlottenburg-Wilmersdorf have, with 39 % and 47 %, a relatively low share of living space. In turn, the share of public facilities is very high, with 20 % and 24 %, respectively. Friedrichshain-Kreuzberg and Mitte are the boroughs with the largest Mixed Area shares (18 % and 14 %). The originally available use mixture can still be recognized most clearly in the boroughs of Mitte and Friedrichshain-Kreuzberg.

Zehlendorf-Steglitz (65% residential use) stand out as neighborhoods with slight industrial use (5%).

Since the edition 2007 is based upon the geometry of the digitized work map 1:5000 (ISU5) it is not directly comparable with former editions (e.g. edition 2004) with the geometry of the digitized work map 1:50000 (ISU50). Particularly with regard to railway- and traffic areas there is a difference in shares of the different uses. Generally appears, with an altogether insignificant alteration, in almost each borough a small augmentation of residential areas and on the other hand a decrease of business and industrial areas.

Map 06.02 ”Inventory of Green and Open Spaces”

shows the different use categories in their shares of the non-built-up areas of Berlin, as well as their distribution throughout the city.

The largest part of the inventory of green and open spaces lies in the outskirts area. The large wooded areas of the Grunewald and the Dueppel forests in the southwest, the Spandau and Tegel forests in the northwest and the large forest areas in the borough Koepenick in the southeast of Berlin stand out particularly. Forests account for 45% of all Green and Open Spaces (without waters) (cf. Fig. 3).

Fig. 3: Shares of the Various Use Categories of the Total Inventory of Green and Open Space of Berlin height of areas based on ISU5, segment block map

Fig. 3: Shares of the Various Use Categories of the Total Inventory of Green and Open Space of Berlin height of areas based on ISU5, segment block map

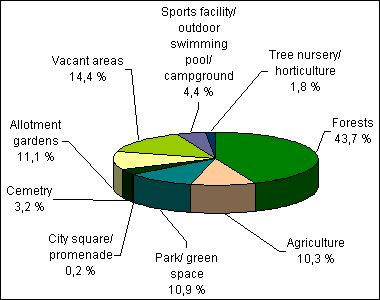
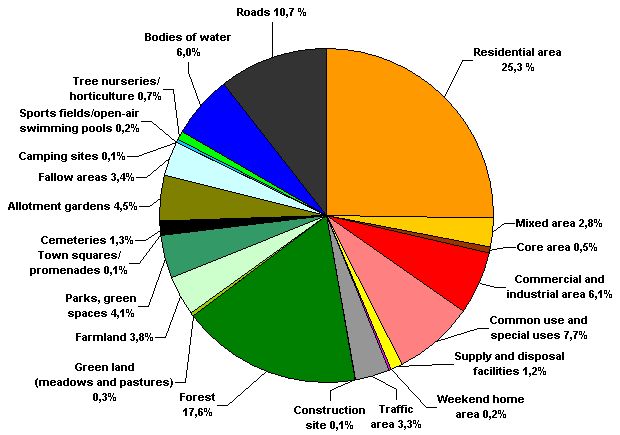
Agriculturally-used areas, which account for almost 11% of the inventory of open space, are found particularly in the northeastern area (Pankow and Weissensee). Other agricultural areas are located in the eastern, southern and western outskirts. Allotment Gardens, which account for an additional 11% of the open space inventory, are found almost. exclusively outside the City Rail Circle Line, in the outer boroughs. Often, they are located near canals, rivers and railroad lines. The currently unused Vacant Areas are distributed throughout the entire urban area, particularly along railroad lines and bodies of water as well as on the airfields. Tree Nurseries and Horticulture areas are found only in the outskirts area, while Sports Facilities, Cemeteries, as well as Parks and Green Spaces are located throughout the entire urban area. The area sizes of the individual open spaces increases as one moves from the inner city area toward the outskirts. In the inner city boroughs, the open space inventory consists mainly of smaller parks – with the exception of the Tiergarten, Sports Facilities, Cemeteries, Vacant Areas and City Squares and Promenades. In the outer areas, the different open-space categories appear frequently in association with one another, e.g. Green Spaces, Allotment Gardens and Sports Areas; or Tree Nurseries, Vacant Areas and Allotment Gardens; or Forests, Meadow and Pastureland and Farmland, while the various open spaces in the inner city area usually occur in isolation, and are surrounded by built-up areas.

Even though a direct comparison with the edition 2004 is not possible a small decrease of the shares of vacant areas and allotment gardens can be observed as well as an increase of forests.

Use distribution for Berlin

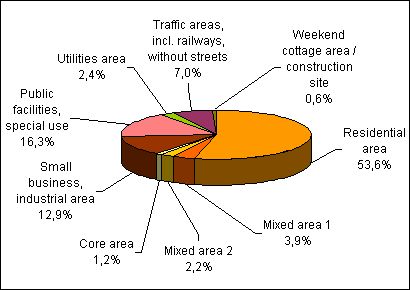
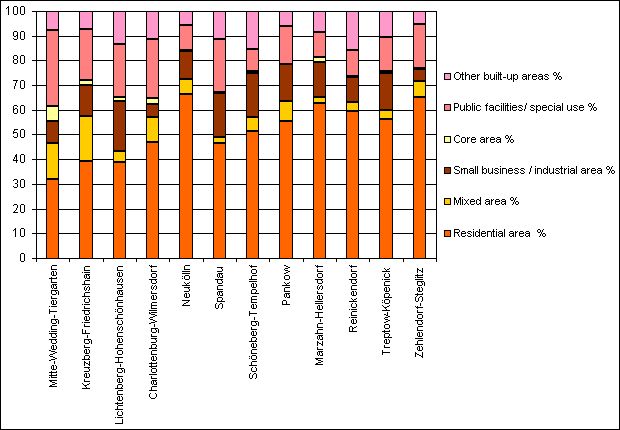
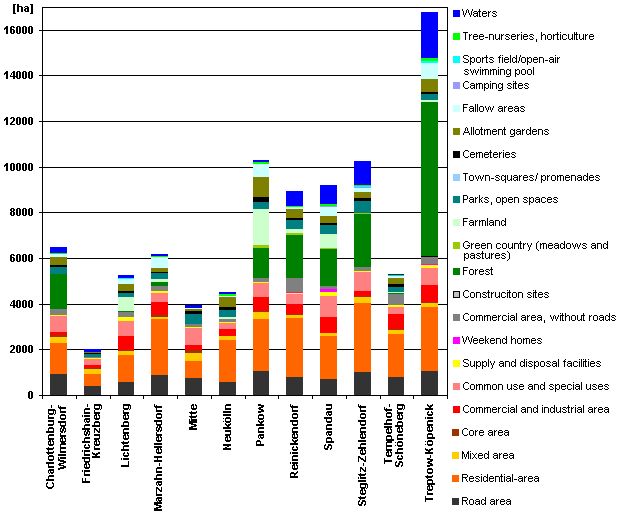
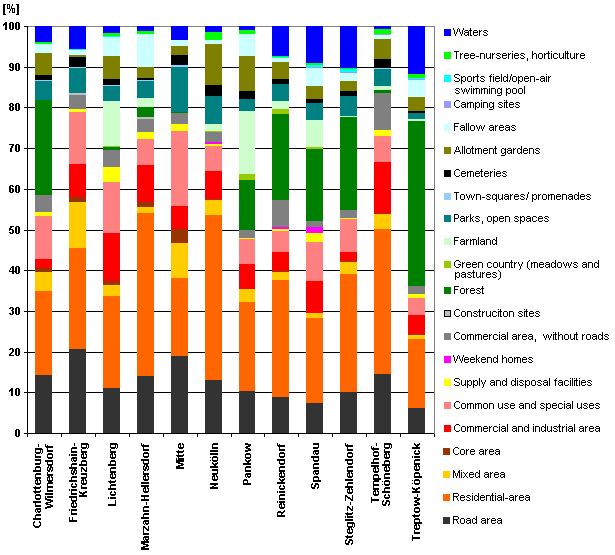
The utilisation proportions shown in Figures 1 – 3 show the proportional values with reference to all built-up and all non-built-up areas, respectively, which in each case represents 100%. The following figures show the proportions of all use types with reference to the total area of Berlin.

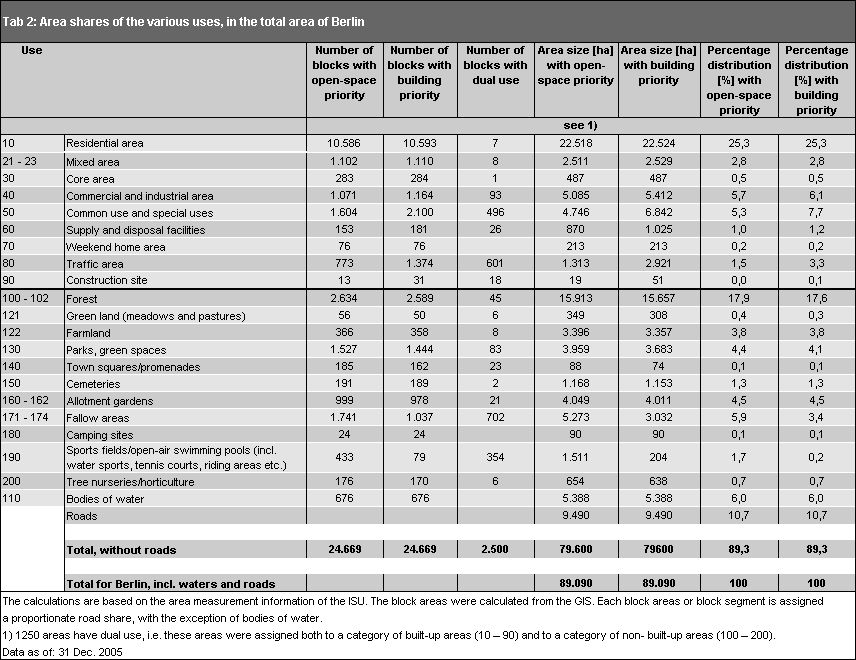
Note that 1250 areas have been assigned a utilisation both in a category of built-up areas (10 – 90) and in a category of non-built-up areas (100 to 200).
Under this procedure, potential green and/or open areas can be documented on areas with other uses. This involves primarily the sites of public facilities and special uses, supply and disposal facilities, commercial and industrial areas, and traffic areas. These areas are hence shown on both maps, i.e., double. Thus, a sports field would be represented both on Map 06.01 as a public facility, and on Map 06.02 as a sports field; a median strip can be listed simultaneously both as a traffic area (Map 06.01) and as a fallow area (Map 06.02).

Since for the evaluation of the overall area proportions, each area can only be taken into account once, both instances – green priority or building priority – were calculated separately. In addition, there is an evaluation of the dual-use areas.

Table 2 shows the absolute and proportional area shares for various uses, based on the total area of Berlin.

Tab. 2: Area shares of various uses, based on the total area of Berlin, Area sizes based on the block segment map ISU 5

Tab. 2: Area shares of various uses, based on the total area of Berlin, Area sizes based on the block segment map ISU 5

Fig. 4: Area shares of the various uses, in the total area of Berlin.

Fig. 4: Area shares of the various uses, in the total area of Berlin.

Referenced to the combined areas of all Berlin boroughs, in absolute terms and in hectares, the following picture is obtained:

Tab. 3: Area shares of various uses in the total area of the boroughs of Berlin in hectares (with building priority); area sizes based on the block segment map ISU 5

Figures 5 and 6 provide a visual overview of the distribution of use types amongst the boroughs, both in absolute terms in hectares, and in percentage of borough area.

Fig. 5: Use distribution (with building priority), by borough, in ha

Fig. 5: Use distribution (with building priority), by borough, in ha

Fig. 6: Proportional shares of different uses of the total area of the boroughs of Berlin in per cent (with building priority)

Fig. 6: Proportional shares of different uses of the total area of the boroughs of Berlin in per cent (with building priority)