Traffic Volumes ADT 1993

Introduction

Development of Traffic Volumes

With the rise in traffic volumes during the past decades, motor vehicle (MV) traffic has caused increasingly serious problems and pollution. Due to its high spatial demands, the water pollution it causes, its cutting effect on urban space and its heavy utilization of the public road space, motor vehicle traffic decreases the quality of life and of visiting, especially in urban residential areas. With the growth in traffic volume, the numbers of traffic accidents, and with it, the number of traffic fatalities and injuries, has climbed. The near-ground air pollutant emissions pose a considerable threat to health, especially in the inner-city area. In addition, growing traffic noise is damaging to physical, psychological and social well-being.

In the foreseeable future, no reduction in traffic volume is to be expected. With the opening of the inner-German border, the gradual development of a common living and economic area, as well as the strengthening ties with eastern Europe, the traffic volume on the streets in Berlin and the surrounding countryside has grown appreciably. According to investigations by the German Institute for Economic Research (DIW), Berlin must calculate, even over the long term, with a further increase in motorized individual traffic.

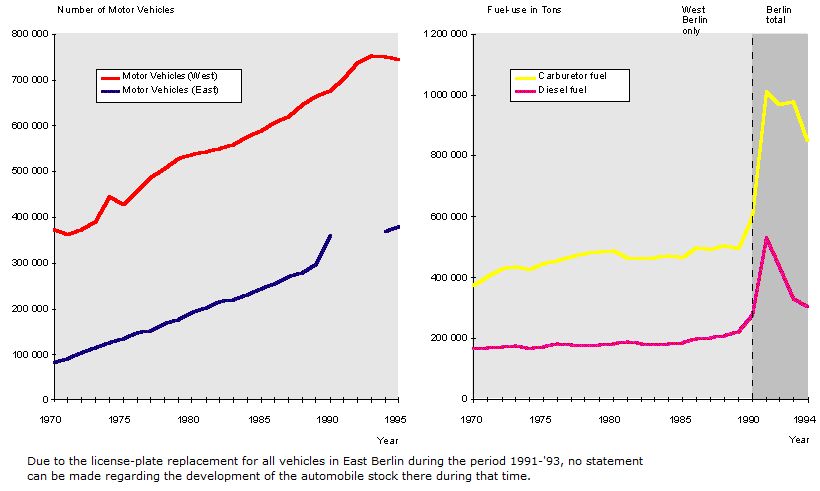
Figure 1 shows a continuously upward development in the stock of cars for both halves of the city, with the eastern part of the city in addition showing an especially steep upward trend in the first year of reunification. Even in the years 1970 – 1980, the amount of all motor vehicles registered increased by around 87 % in East Berlin, from about 139,000 to 261,000; in West Berlin, by contrast, the gain was only around 46 %, from 411,000 to 661,000. Here, the increased motorization of the population had already begun in the ’60s, so that the further increase was slighter during the following years. Between 1980 and 1995, the motor vehicle stock increased in the eastern part of the city by some 59 %, in the western part, during the same period, by around 45 %. Thus, the number of motor vehicles in East Berlin tripled to 415,000 (plus 197 %) over a period of 25 years, while in West Berlin, for the reasons stated, it still doubled to 873,000 (plus 112 %).

Fig. 1: Automobile Stock and Fuel Use Berlin, 1970 - 1995

Fig. 1: Automobile Stock and Fuel Use Berlin, 1970 - 1995

Of the total of almost 1.3 million registered motor vehicle on Berlin’s streets, the number of cars must be especially considered, because they decisively determine the volume of motorized individual traffic. Their number increased in East Berlin by around 350 %, from 84,000 to 380,000, between 1970 and 1995. In West Berlin the number of cars doubled during that period (1970 to 1995) from 373,000 to 745,000.

Gasoline consumption has risen very much less steeply than the number of vehicles themselves. The relatively steep rise after 1989 can be explained by the fact that, after the political transformation in East Germany, the number of cars in East Berlin and in the countryside surrounding Berlin rose abruptly, while the number of gasoline stations increased only over the course of the last years. Therefore, during the first years, many East Berliners and Brandenburgers drove to West Berlin to fill up, while today, the trend is in the opposite direction, due to the lower-priced gasoline available in the countryside surrounding Berlin.

Motorization Level

The motorization level, i.e., the ratio of cars to the number of inhabitants, was also different for East and West Berlin in 1970. Thus, there were 77.5 cars per 1,000 inhabitants in East Berlin in 1970, compared to 175.4 in the western part of the city – a difference of almost 100 vehicles per 1,000 inhabitants. In 1995, partially due to reunification, the numbers are clearly closer together: In East Berlin, 1,000 inhabitants now have 302 cars at their disposal, compared to 346 in West Berlin (cf. Fig. 2). In comparison with other cities, Berlin thus still has a favorable level: Munich, with 570 cars/1,000 inh., and Hamburg with about 500 car/1,000 inh., show far higher values.

Fig. 1: Level of motorisation in Berlin, 1970 - 1995 (according to information from the Berlin State Resident Registration Agency, the State Statistical Agency, and the Berlin Department of Economy)

h6. Due to the license-plate replacement for all vehicles in East Berlin during the period 1991-1993, no statement can be made regarding the development of the automobile stock there during that time.

The area-related motorization in East Berlin totaled about 1,000 motor vehicles per square kilometers (MV/km2) in 1995; in West Berlin, because of the higher settlement density, it was clearly higher, about 1,800 MV/km2.

Aside from the constant increase in the number of motor vehicles and of the total kilometers driven, the spatial distribution of traffic changed due to new and changed flows of traffic. If before reunification Berliners traveling from the eastern part of the city toward Potsdam or Brandenburg tended to be concentrated, on the beltway around West Berlin, this flow has now been shifted to a large extent to inner-city highways and city streets. Due to travel by employees and visitors between East and West Berlin, a new traffic flow has emerged between the formerly separated boroughs. Major traffic corridors into the surrounding countryside, which were formerly hardly used at all in West Berlin, are today loaded with commuter and weekend traffic very much more than before.