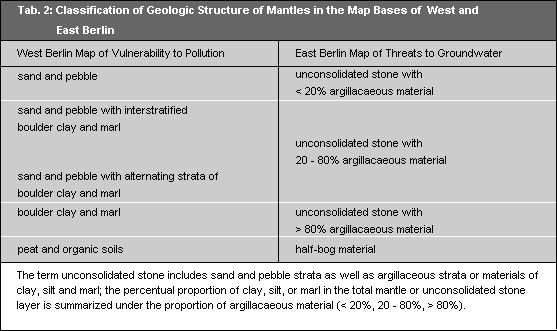
The lack of opportunity to examine the geological bore samples made it impossible to differentiate the 3 classes of vulnerability to pollution used in the East Berlin map. It was also impossible to transpose the different systems used for the mantle. The East Berlin map typifies a mantle of unconsolidated stone with 20 – 80% of argillacaeous material. The West Berlin map gives 2 typifications: a sand and pebble mantle with interstratified or with alternating strata of boulder clay and boulder marl. The map for all Berlin used the mantle classification and the 3-stage evaluation of vulnerability to pollution method of the GDR Hydrogeological Cartography.
The two mantle types used in West Berlin (sand and pebble mantle with interstratified or with alternating strata of boulder clay and boulder marl) were considered equivalent to the mantle type used in East Berlin (mantle of unconsolidated stone with 20 – 80% of argillacaeous material). It is questionable if this may be correct in every case, or if the portion of argillacaeous material might sometimes be under 20 or over 80%.
Preference was also given to the method used by the Hydrogeologic Cartography for reasons of content. The West Berlin map describes the cohesiveness of the mantle only qualitatively (interstratified or alternating strata). The East Berlin map describes the proportion of argillacaeous material quantitatively. This proportion of total mantle thickness is the most important criterium for the evaluation of vulnerability to pollution based on percolation velocity. This velocity is determined by the strata with the lowest permeability. The GDR Hydrogeological Cartography mantle classification method is the more suitable approach for a later differentiation of the 3 classes of vulnerability to pollution. The mantle classification of unconsolidated stone with a 20 – 80% proportion of argillacaeous material is more suitable because of its wide range in registering the proportion of argillacaeous material. This range could be further subdivided, based on more precise strata analyses
of bore samples. Much finer increments of the evaluation matrix are possible.
The further differentiation of the endangerment classifications is based on depth to groundwater from the surface.
The West Berlin vulnerability to pollution map did not depict the depths to groundwater from the surface necessary for evaluation in its classifications. The Groundwater Depths (from the surface) Map was used as an aid. This map was based on uniform measurements of groundwater table contours made in May, 1983 (depth was calculated from terrain contours and groundwater table contours). The data for Spandau forest were gathered in 1987.
A discrepancy between the Map for Vulnerability to Pollution and the Map of Groundwater Depths occurred in the 0 – 5 m category. A 5 m depth line was used in West Berlin at that time for the evaluation of the vulnerability to pollution, but the 4 m depth line was portrayed in the Map of Depths. For West Berlin then, the 4 m line must be read as the 5 meter line.
Depths to groundwater from the surface given in the East Berlin Map of Threats to Groundwater were also calculated from terrain contours and groundwater table contours. But measurements were not made at the same time of groundwater table contours at bore sites. The measurement values of groundwater level used in the preparation of this map were taken from hydrogeological reports made in the 60’s and 70’s.
Neither the development of new water plants after 1980 nor the changes in amounts of existing water suppliers were considered. These would cause changes in groundwater flow patterns, especially groundwater tables.
Discrepancies in depths to groundwater from surface are mainly due to these differences in the statistical base. These discrepancies appear between West Berlin and surrounding areas (especially visible between Spandau and Hennigsdorf to Staaken), and in areas used as security borders around West Berlin.
It should be generally noted that depth to groundwater from the surface is a continually changing value, determined mainly by precipitation and evaporation. Depths are less each spring than they are in the fall, even in years of high precipitation. The variations in depth to groundwater from the surface influence the changing limits of various areas of vulnerability to pollution, but are of less importance for precision.
The East Berlin Map of Threats to Groundwater surveyed areas of half-bog formations only incompletely. The preparation of the map included here did not correct this deficiency.
Figure 1 is a schematic portrayal of a few example combinations of the geological structure of the mantle and depth to groundwater from the surface. They were classified into high, medium, and low categories of vulnerability to pollution.