Map Descriptions
General
For the State of Berlin, the maps show the temperature distribution in the subsoil for five different depths for the reference horizons 20 m, 40 m, 60 m, 80 m and 100 m below terrain surface and the average temperatures for the depth ranges 0 m to 50 m and 0 m to 100 m. It should be taken into account that the results shown represent the temperature distribution not as point-referenced information, but rather as a tendency, since the isothermal contours may be subject to relatively large uncertainties, depending on the density of available measurement points. The continuous isotherms are regarded as relatively certain, whereas the dashed isotherms are to be regarded as "conjectured".
The map information on temperature distribution should always be used in cases where no representative temperature measurements exist for the site. It should be taken into account that the results of a temperature measurement only apply precisely for the depth profile ascertained. Depending on the variability of the site characteristics, other conditions may well prevail only a few hundred meters away which could lead to changes in the temperature of the subsoil. Without taking these changes into account, a transfer of information even to a site very close to the measurement point could lead to considerable false assessments of temperature conditions.
Temperatures 20 m below the terrain surface
The updated geo-thermic map (measurement 2015) shows considerable differences compared with the previous edition of the map from 2014 (measurement from 2012) for the reference horizon 20 m below terrain surface (Map 02.14.1). This is to some extent due to the fact that significantly fewer measurement points have been incorporated into the ascertainment process of temperature distribution, and that, compared to the last measurement from 2012, in the 2014 edition for some measurement points significant temperature changes were registered or measurement value corrections had to be carried out.
Basically, though, an initial estimate of temperature conditions at a site which can be used for geothermal energy is possible on the basis of the present maps.
Generally, a tendency towards higher temperatures from the outskirts to the city centre can be observed. The temperature progression shows a continuous increase from the northeast toward the city centre, while in the other areas of the city, the appearance of several smaller positive and negative temperature anomalies is characteristic.
The densely built-up city centre with its highly impervious surface is enclosed by an 11.5 °C contour line 20 m below terrain surface (Map 02.14.1). The heat island with temperatures of more than 12.5 °C which is apparent in the city centre is interrupted by the Great Tiergarten, a large green space in the centre of the city. Within this heat island, temperatures anomalies greater than 13.5 °C can be observed.
Outside of the city centre, too, positive temperature anomalies correlate with highly impervious areas, such as secondary centres and industrial areas.
Below the extensive woodlands on the outskirts to the southeast, the north, the northwest and the southwest as well as in the area of the Grunewald, the temperatures are in the range below 10.5 °C. The temperature anomalies observed in the past, with less than 10.5 °C in the municipal area, e.g. the Britz Gardens, or the Tempelhof Field, both areas with a high proportion of vegetation, do not occur in the current map. This is partly due to the considerably lower density of measurement points. In this case, no measurements were carried out in the catchment area of these two areas.
Groundwater temperatures in the densely populated inner-city area are generally more than 4 K higher than in the open countryside.
Temperatures 40 m, 60 m, 80 m and 100 m below the terrain surface
The other maps (02.14.3 – 02.14.6) show the groundwater temperature distribution for the reference horizons 40 m, 60 m, 80 m and 100 m below terrain surface in the State of Berlin. At these depths continuous, partly anthropogenic temperature variations which e.g. are caused by a changed structural development or climatic changes can, however, manifest themselves in the long run.
Such temperature anomalies can be observed particularly in the inner-city areas in the borough of Mitte, but also at the southern edge of the city in the Lichterfelde neighbourhood at the Teltow Canal, with its long-term building use and its intensive industrial utilization (groundwater temperature distribution for the reference horizons of 80 m and 100 m).
Other temperature anomalies, such as those in the south-western part of Berlin at the border with Potsdam, in the northern portion of the Grunewald forest in the area of the natural gas storage area, and in Lübars, at the northern border of Berlin, are caused by geological structures in the deeper subsoil. These temperature anomalies are assumed to be connected with the salt dome structures in the deep subsoil that are known to exist in the Berlin area.
The current map does not exhibit the temperature anomalies that occurred in the 2014 edition in the deep subsoil more than 80 m below terrain surface, such as in the Rudow/Altglienicke area in south-eastern Berlin, in the Lichtenberg, Marzahn und Hellersdorf neighbourhoods in the east of the city. Here, too, the reason lies in the missing measurements. The temperature statements in these areas still involve relatively great uncertainties.
Average temperature 0 m to 50 m and 0 m to 100 m below the terrain surface
As a supplement to the maps for the groundwater temperature distribution for the different reference horizons, two maps were additionally compiled for the average temperatures in the depth ranges 0 m to 50 m and 0 m to 100 m. The two maps also serve as an aid for estimating the specific power of ground heat exchangers.
The map for the depth range 0 m to 50 m shows that in particular the densely built-up inner-city area exhibits average temperatures above 11 °C. In the outskirts, the average temperatures are approx. 10 °C, and in the non-built-up periphery approx. 9 °C.
For the depth range 0 m to 100 m, the area with average temperatures of approx. 12 °C is considerably larger than in the depth range 0 m to 50 m; it includes the inner-city area and the immediately adjacent urban areas. In the outskirts and in the periphery of Berlin the average temperatures lie between 10 °C and 11 °C.
In the context of the two maps it is pointed out that due to the local climate conditions and the density of available measurement points, the indicated average temperatures may exhibit small-scale deviations. For instance, in areas with a high proportion of green spaces a lower average temperature may occur, whereas higher average temperatures may occur in highly industrialised areas with high surface sealing.
Summary
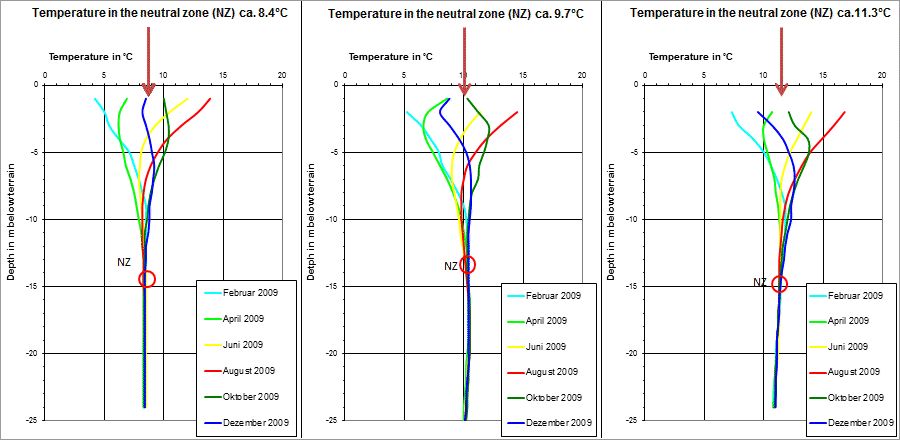
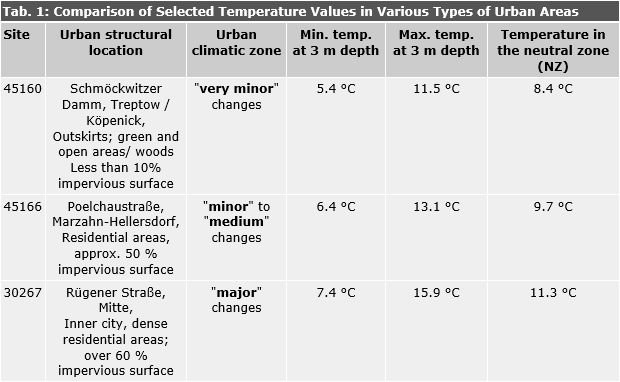
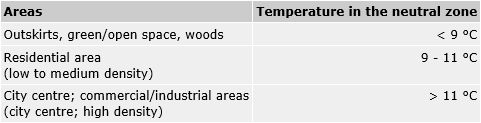
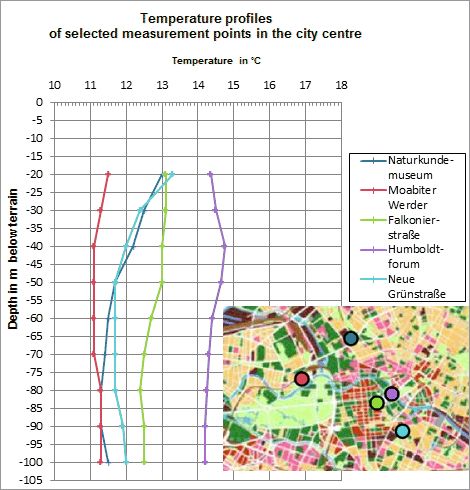
In summary, it can be ascertained that groundwater temperature increases in the densely populated inner-city area of more than 4 K compared with the open countryside can occur, which thus constitutes a considerable degree of warming. There is a clear connection with urban climatic conditions at the surface. The results of regular investigations at selected special temperature measurement points in locations of varying urban structures also confirm this.
Overall, the near-surface groundwater temperature distribution in the State of Berlin generally shows a connection with the distribution of industrial facilities, major buildings, waste heat producers, impervious surfaces, open spaces and surface waters warmed due to anthropogenic activity (see also Henning 1990). Taking the groundwater flow field into consideration, it can be assumed that these factors have a substantial influence on the change in groundwater temperature. Since there is generally an overlapping of such factors in the city, these quanta are mutually reinforcing.
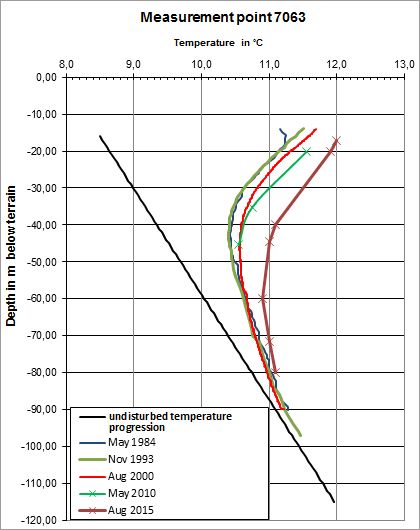
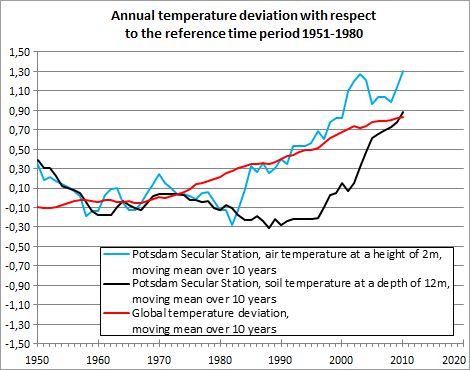
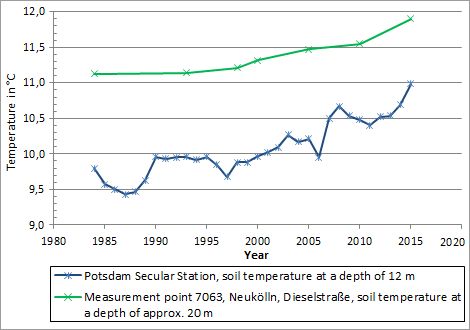
On basis of data from long-term investigations, it can be shown that due to progressive structural development and also to general climate change, a further very considerable warming of the near-surface (< 20 m depth), and also in the deeper subsoil (to 100 m depth) subsoil, and hence also of the groundwater, can be assumed.