Impervious Soil Coverage (Sealing of Soil Surface) 2016

Methodology

The evaluation procedure was based on the use of ALKIS and additional building data for impervious built-up areas, and on the analysis of high-resolution multi-spectral satellite-image data for the impervious non-built-up areas.

A Sentinel-2A scene was used. Relevant information from the Environmental Atlas, the Urban and Environmental Information System (ISU), and the already ascertained corrective factors developed from the data of the Berlin Waterworks (BWB data) were incorporated into the classification process.

The mapping procedure consists of three evaluation steps:

  • Mapping of impervious built-up areas,
  • Mapping of impervious non-built-up areas,
  • Derivation of the degree of impervious coverage.

The mapping of impervious coverage concentrates on block and block segment areas; transportation routes and bodies of water are not considered. The following illustration shows the use of the various data from the agencies and from geo- and satellite image data in the Berlin mapping procedure for impervious areas.

The complete Final Report of the Impervious Coverage Mapping Procedure 2016 can be downloaded from the chapter Literature (Coenradie & Haag 2016) as a PDF file (only in German).

Fig. 2: Diagram of the hybrid mapping procedure

Mapping of Built-up Impervious Areas

In Edition 2017, the delimitation of the built-up impervious areas was carried out based on two data bases for the first time. On the one hand, the ALKIS building data was used. Since it contains gaps, especially regarding allotments, so-called Non-ALK data from the Environmental Atlas Map “Building and Vegetation Heights” (06.10, SenStadtUm 2014) was used on the other hand. Integrating building data into the mapping process constituted the first component of the hybrid method approach. For these areas, no evaluation has been carried out via satellite-image data.

The use of additional building data (Non-ALK) also impacts upon the mapping of changes between 2011 and 2016 and is especially noteworthy. Based on the improved data base of the building stock, the proportion of the built-up area also changes for blocks that actually remain unchanged (pseudo-changes). This involves 718 blocks. Major changes in ISU block geometry affected 424 block and block segment areas between 2010 and 2015, resulting in area size changes of more than 10 %. Here too, pseudo-changes may occur in the impervious coverage mapping.

Mapping of Non-built-up Impervious Areas

For the mapping of the impervious non-built-up areas, a classification approach was used in which satellite-image data (Sentinel-2A) and geo-data (building data, ISU) were incorporated and combined.

The satellite-image evaluation consists of the following evaluation focuses.

Categorization of Area Types Relevant for Remote Sensing

To improve the mapping results, a categorization of ISU area types according to the remote-sensing-relevant criteria building height, vegetation height, reflection quality, heterogeneity and relief, as well as the average degrees of impervious coverage (2001) was carried out. This permitted spatially separate segment classifications, and an optimized choice of methodology respectively. Eighteen categories were defined.

Spectral Classification of Non-Built-Up Areas

The satellite-based remote-sensing data was further processed by means of a machine-based, automatic classification procedure. First, the degree of vegetation coverage of non-built-up areas was ascertained via the Normalized Differenced Vegetation Index (NDVI).

This index is based on the fact that healthy vegetation reflects relatively little radiation in the visible spectral range (wavelengths of approx. 400 to 700 nm), and relatively much more in the subsequent near-infrared range (wavelengths of approx. 700 to 1300 nm). In the near-infrared range, this reflection is strongly correlated with the vitality of a plant: the greater the vitality, the higher the increase of the reflection coefficient in this spectral range. Other surface materials, such as soil, rock or even dead vegetation, show no such distinctive difference in reflection coefficients for these two ranges. This fact can thus serve to distinguish areas covered with vegetation from bare areas, and also to obtain information on photosynthetic activity, vitality and density of vegetation cover. This standardization yields a range of values between -1 and +1, where “an area containing a dense photosynthetically active vegetation canopy” will tend to positive values close to 1 (e.g. Hildebrandt 1996).

Particularly relevant surface materials, such as sand, ash and tamped soil, track gravel, artificial surfacing, as well as shaded areas, which are frequently evaluated faultily, must continue to be examined with special care.

Figure 3 shows the spectral classification procedure, which consists of 6 partial evaluations.

Fig. 3: Diagram of the spectral classification of non-built-up areas

The degrees of impervious coverage are obtained step-by-step from the degrees of vegetation coverage per pixel ascertained. The method is based on the following assumptions:

  • There is a linear connection between NDVI and degree of vegetation coverage: the higher the NDVI value, the more vital vegetation will be present.
  • There is a high negative correlation between degree of vegetation coverage and degree of impervious coverage.

Vegetation-free areas (degree of vegetation: 0 %) are reflected by low to very low index values. More detailed distinctions between impervious and pervious sections are not possible via NDVI.

Areas completely covered by green vegetation (degree of vegetation: 100 %), such as forests or grasslands are largely reflected by high to very high index values. These areas were classified as pervious.

The problem of the local obscuring by treetops of impervious areas is not soluble via the evaluation of satellite-image data. To correct for this “error”, context-related correction factors were ascertained and used, with the aid of ISU data. The ascertainment and distinction process of the graduation of degrees of vegetation coverage (degree of vegetation coverage: > 0 % and < 100 %) was methodologically demanding. Medium index values predominated. The fact that identical index values could result from different mixtures of signatures had to be taken into account.

The present procedural development made use of these differences: NDVI values which indicate partial vegetation coverage of areas (vegetation degree > 0 %) were considered in a differentiated manner, and assigned to different degrees of impervious coverage in the rule-based classification system, depending on area type or area-type category.

Based on this approach, 12 NDVI categories were established (cf. Table 2).

In the context of the process of the mapping of changes, the degrees of impervious coverage in 2011 are to be compared with those in 2016, for which purpose the spectral properties and phenological properties of the satellite image scenes have to be comparable. One advantage of the 2011 and 2016 impervious coverage maps is that both scenes were taken in May and are similar in their phenology. The satellite images of 2016 could thus be adapted both geometrically and radiometrically to the existing reference system of 2011, the so-called “master scene”.

Track gravel was to be evaluated differently in the context of the use of the data on impervious coverage. In some contexts, it is considered impervious, for others, it is assigned to the “pervious areas” category. Therefore, such areas were classed separately within railyards. A “track gravel” category was created, which can be assigned optionally to either of the two impervious coverage categories.

The spatial proximity of the materials iron, gravel and in some cases the wood of the rail ties yielded a largely characteristic reflection of track gravel. Here, ascertainment was more difficult, due to a category-typical spectral heterogeneity. Particularly distinction from such impervious surfaces as streets was not always possible for certain. To avoid mis-mapping, the mapping of track gravel was carried out exclusively within the area-type categories “Railyards without track areas” and “Track areas”. Moreover, the K5 rail route network was used, which made it possible to detect tracks secured by treetops as well.

The corrected classification components were brought together into a pixel-based data set, which formed the basis for the subsequent rule-based classification system. The mapped sand, artificial-surface and track-gravel areas were aggregated with the impervious built-up building areas to form a classified combined-block area.

The category “Shade” remained separated from the other categories.

Rule-Based Classification

Under rule-based classification, the results of spectral classification are combined with ISU data (area types) to yield degrees of impervious coverage derived at the pixel level. For this purpose, we first proceeded by using the set of rules developed for the Edition 2007, and carried out a preliminary mapping process for 2016. Figure 4 shows a schematic overview.

In order to improve the comparability between two mono-temporally derived rule-based classifications, a second step was carried out involving a multi-temporal change analysis of satellite image data between 2011 and 2016.

Fig. 4: Diagram of rule-based classification - preliminary mapping

The classes and the NDVI categories were then assigned to degrees of impervious coverage. A reliable delimitation of completely vegetation-free and completely vegetation-covered areas was achieved in the NDVI categories 1 and 12 (lowest and highest NDVI values, respectively). The corresponding threshold values were derived automatically by means of reference areas.

  • NDVI Category 12 “Vegetation – certain”. Under the rules, such areas were classified as 0 % impervious. This applied to all area-type categories.
  • NDVI Category 1 “Vegetation-free – certain”. Vegetation-free areas were only considered to be 100 % impervious once they had been determined to not be neither “Sand” nor “Track gravel”.

The range of values between these NDVI limits is broken down via interval scaling into ten additional NDVI categories of “Vegetation – uncertain”. In order to obtain a reliable assignment of degrees of vegetation and impervious coverage, they had to be interpreted differently, by area-type category or area type. Thus,three assignment variants were established (cf. Table 2), with the mean percentage value (5 %, 15 %, …, 95 %) the conversion factor for each NDVI and impervious coverage category.

Recommendations from the concept study, the analysis results of Haag 2006 and findings from aerial image interpretations, and terrain inspections were incorporated, and results of the procedural validation process (cf. Validation, Edition 2007) were taken into account for the iterative process optimization.

Tab. 2: Assignment variants: degree of vegetation - degree of impervious coverage

Tab. 2: Assignment variants: degree of vegetation - degree of impervious coverage

The assignment variants were oriented toward certain area types, which are characterized by the spatial interconnection and proximity of certain surface materials and types of buildings.

The new rule-based classification for 2016 and the previous one of 2011 were thus available as intermediate results. These sets of map data were interlinked, and also linked to the current ISU block map of 2015, in order to obtain reliable information on changes of degree of impervious coverage at block and block segment level.

Methodologically, the following aspects had to be taken into account in this process:

  • Ascertainment of changed areas and elimination of pseudo-changes by means of multi-temporal change mapping,
  • Comparability of the blocks in terms of geometry and area type category.

For the reliable ascertainment of suspected areas, which indicated changes in impervious coverage (see below), the satellite image data of 2011 and 2016 for the non-built-up areas were first of all analyzed, and secondly, the building data on possible changes in the built-up impervious areas were examined.

Figure 5 provides an overview of the derivation of the results of the 2016 rule-based classification:

Fig. 5: Diagram of the 2016 rule-based classification

Using the procedure of principle component transformation (cf. Richards & Jia 1999, Coenradie 2003), the respective NDVI channels for 2011 and 2016 were analyzed, and suspected areas, i.e. those which, based on their NDVI values, indicated possible changes in impervious coverage, were statistically derived.

The conclusive rule-based classification in 2016 was derived from a set of rules from the rule-based classification of 2011, and from the 2016 intermediate results. For unchanged blocks, the 2011 classification was retained. The rule-based classification in 2016 was adopted in the following cases:

  • changed blocks (changes of the ISU area type, or major changes of block geometry),
  • suspected areas within unchanged blocks (changes in spectral properties, taking into account the phenology, ascertained by means of principle component transformation),
  • previously built-up areas which, according to the current ALKIS building stock, no longer contain any structures (demolition).

The conclusive result of the rule-based classification system in 2016 for the non-built-up blocks corresponded to the final result of the satellite-image classification process. The category “non-built-up impervious areas” has been described in the classification with the 12 impervious coverage-degree categories, a Shade class and a Track-gravel class.

Figure 6 shows the result of the 12 impervious coverage-degree categories, a Shade class and a Track-gravel class, and the built-up impervious areas from building data, on a grid basis. Based on this intermediate result (grid data), the mean degrees of impervious coverage per block area were then calculated (cf. Calculation of the Degrees of Impervious Coverage).

Fig. 6: Uncorrected degrees of impervious coverage (grid data) - intermediate results of rule-based classification

Fig. 6: Uncorrected degrees of impervious coverage (grid data) - intermediate results of rule-based classification

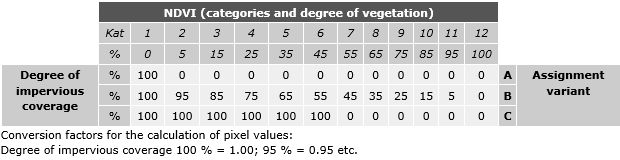
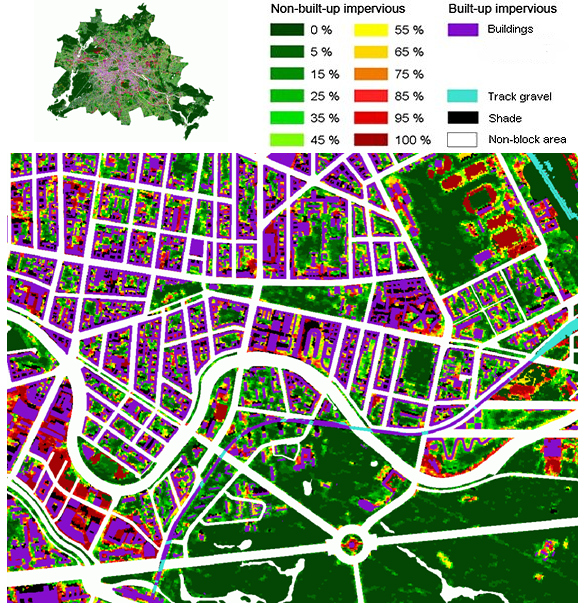
The intermediate result published in the FIS Broker as the 2016 “Impervious Coverage Map (uncorrected degrees of impervious coverage, grid data)” shows the distribution of impervious coverage within the blocks and block segments. The effect of shade in the various blocks can also be seen. However, it is both a grid map as well as an uncorrected intermediate result of the impervious coverage mapping, i.e. a satellite data result based on a rule-based classification. At the grid level of 2.5m x 2.5m, twelve impervious coverage-degree classes are displayed for the non-built-up area. Furthermore, the buildings are mapped based on various building data, i.e. built-up impervious areas, as well as track gravel and shaded areas. The grid level information was aggregated for the impervious coverage map of the Environmental Atlas at block area level and further processed and corrected in parts. The black shaded areas present here were assigned a degree of impervious coverage, e.g. based on their surroundings and their area types (see below).

The Map “Impervious Soil Coverage” (01.02) by contrast, shows the mean degree of impervious coverage per block area.

Calculation of Degrees of Impervious Coverage at Block and Block Segment Level

The goal of the impervious-coverage mapping process is the derivation of the degrees of impervious coverage at block and block segment level in absolute and relative area numbers. Three degrees of impervious coverage (IC) were distinguished:

  1. IC – built-up impervious area (calculated from building data),
  2. IC – non-built-up impervious area (calculated from satellite data),
  3. IC – total (sum of 1 and 2).

For the calculations, the results of the pixel-based satellite-image classification were collated with the areas from the ISU5 block map 2015.

First, a summation by category of degree of impervious coverage and block (segment) area was carried out. Thus, the grid data of the classification system was no longer necessary for further analyses.

There were thus 15 area-referenced statements in sq. m. for each block and block segment:

  • Built-up area (from building data)
  • 12 categories of degrees of impervious coverage of the non-built-up area (corresponding to NDVI categories)
  • Track-gravel areas (optionally either 0 % or 100 % impervious), and
  • Shaded area (unclassified).

For the further improvement in the mapping results, the following additional calculations were carried out.

Optional Assignment of an Impervious-Coverage Value to Track-Gravel Areas

The class “Track gravel” has been maintained as a data field of its own, and can optionally be included in the calculations either as an impervious non-built-up (100 %) or pervious built-up area (0 %). This ensures the different evaluation of gravel according to the subject matter at hand. In the map shown, track gravel is considered 100 % impervious.

Classification of Shaded Areas

Shaded areas have been assigned impervious-coverage values at block level in a follow-up classification procedure at block (segment) area level using ISU or BWB data.

For this, the shaded areas were analyzed depending on area type. For area types with predominantly residential use and adequate BWB data, the latter was used for the classification of the shaded areas. For all other area types, shaded areas were classified in accordance with their block-specific surroundings.

Evaluation of Built-Up and Non-Built-Up Impervious Areas in the Category “Allotment Garden”

Due to the improved data base for buildings, it was possible to record the built-up impervious area share more accurately than was the case still for the 2005 and 2011 mappings. However, as there are still gaps in the building data, especially in this category, e.g. due to unmapped cottages and sheds, shares of the non-built-up impervious area were also counted as part of the built-up area in the current impervious coverage mapping, based on the mean values laid down in the Bundeskleingartengesetz (Federal Allotment Garden Law) and those specific to Berlin (SenStadtUm, I C 2009). A degree of impervious coverage for built-up areas of 9.6 % for West Berlin and 8.6 % for East Berlin was assumed.

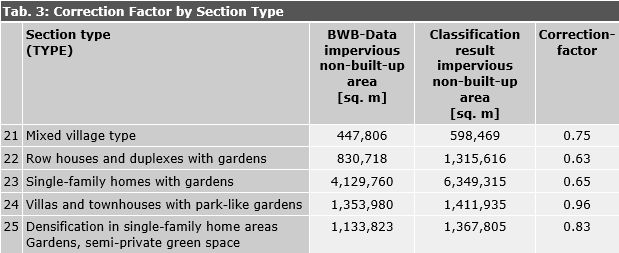
Application of Corrective Factors

To further improve the mapping results, so-called corrective factors were employed. The BWB data on impervious soil coverage was used for this purpose. The principle of area-type-referenced corrections is based on the following well-founded assumptions:

  • the BWB data was still largely up-to-date at the time corrective factors were developed,
  • the BWB data was adequately precise, due to the ascertainment methods (terrestrial inspection, aerial-image interpretation, building-owner information),
  • the one-time calculation of corrective factors makes them transferable to future evaluations, since they describe systematic trends in a city-wide comparison.

Due to a lack of topicality, overlap problems, differing definitions of impervious coverage, and gaps in impervious coverage ascertainment of some use types by the BWB, corrective factors could be calculated only for 5 area types (cf. Table 3).

Corrective factors were only applied to non-built-up areas.

Tab. 3: Corrective factor by area type

Tab. 3: Corrective factor by area type

Adoption of the Pavement Types from 2001

The pavement types of the non-built-up impervious block segments (walkways, courtyard areas etc.) were grouped into four pavement-type classes, from concrete to grass trellis stones. Their respective distribution was investigated via selected test areas, and the results transferred to all areas of the same area type. The type-specific pavement type distribution was not updated for the current map, but is based on a survey from 1988 (AGU Arbeitsgemeinschaft Umweltplanung (Environmental Planning Working Group) 1988). The pavement types are not shown on the map; however, they can be shown in the Geoportal via the factual data display by block (segment) area.

Tab. 4: Pavement classes in non-built-up impervious areas by area type

Tab. 4: Pavement classes in non-built-up impervious areas by area type

Degrees of impervious coverage of roads

The degree of impervious coverage of roads is based on the evaluation of road statistics from the Senate Department for Urban Development and the Environment, Grundsatzangelegenheiten der Straßenbautechnik und der Straßenerhaltung, Tabelle Fahrbahndecken und Beläge der Straßen und Gehwege in der Baulast Berlins (Policy matters of road construction technology and road maintenance, table of road surfaces and pavement types of roads and walkways subject to maintenance by Berlin) (as of January 1, 2016), covering 8,950 ha of roads excluding motorways (SenStadtUm 2016b). The data for these statistics is available for each borough. The degree of impervious coverage per borough resulting from these statistics was assumed to be valid for all road areas within the respective boroughs.