Hydraulic Permeability of the Subsurface 2019

Map Description

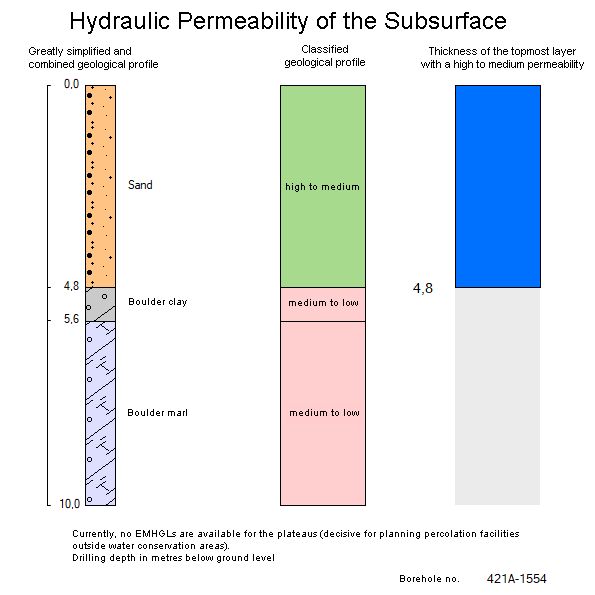
These maps illustrate the thickness of the sediments with a high to medium hydraulic permeability down to the first cohesive layer, i.e. those sediments whose hydraulic permeability is only medium to low, for the State of Berlin.

The calculation from the ground level to the first cohesive layer was carried out in Map 02.22.1; Map 02.22.2 presents the calculation starting at one metre below the ground level to the first cohesive layer.

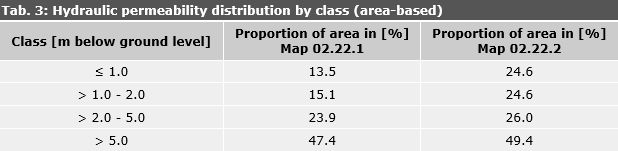
The thickness of sediments with a high to medium hydraulic permeability is shown in four or three colour shades on the map (0 -1 m, 1 -2 m, 2 -5 m, >5 m); in the case of measurements disregarding the first metre, the map only displays three classes (1 -2 m, 2 -5 m, >5 m). The selected classification is based on the requirements of different types of percolation facilities (surface, swale or swale-infiltration trench).

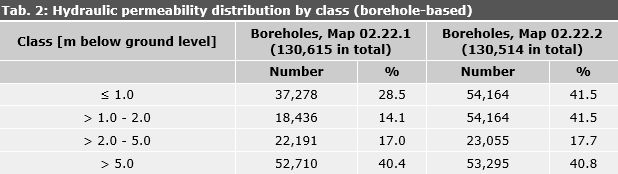
Table 2 illustrates the classification of individual boreholes into the thickness class of sediments with a high to medium hydraulic permeability down to the first cohesive layer.

Tab. 2: Hydraulic permeability distribution by class (borehole-based)

Tab. 2: Hydraulic permeability distribution by class (borehole-based)

The distribution (in percent) of the individual thickness classes down to the cohesive layer across Berlin reveals that, unlike in the borehole-based overview, almost 50 % of the area is assigned to the class >5.0 m (Table 3).

Tab. 3: Hydraulic permeability distribution by class (area-based)

Tab. 3: Hydraulic permeability distribution by class (area-based)

Presenting individual boreholes

In addition to an area-based presentation illustrating the thickness of the topmost layer with a high to medium hydraulic permeability, a borehole-related diagram may be accessed by clicking onto the connected borehole. This includes a greatly simplified geological profile, the classified geological profile and the thickness of the topmost layer with a high to medium hydraulic permeability for a specific borehole (Fig. 4a, 4b). Furthermore, depths to groundwater relevant for designing percolation facilities are displayed, whereby a distinction is made between the following cases based on the location of the borehole:

  • in the glacial spillway and the Panke Valley outside water conservation areas: depth to groundwater to the EMHGL (decisive for planning percolation facilities outside water conservation areas).
  • inside water conservation areas: depth to groundwater to the EHGL (decisive for planning percolation facilities inside water conservation areas).
  • plateaus: currently, no EMHGLs are available for the plateaus

Fig. 1a: Diagram of a borehole incl. information on the thickness of the layer with a high to medium hydraulic permeability and the depth to groundwater.

Fig. 1b: Diagram of a borehole incl. information on the thickness of the layer with a high to medium hydraulic permeability

Fig. 1b: Diagram of a borehole incl. information on the thickness of the layer with a high to medium hydraulic permeability

The maps on the hydraulic permeability of the subsurface and the classified profiles form a high-level resource for planning and guiding the construction of decentralised rainwater percolation facilities. They do not allow for a small-scale investigation of the percolation potential, due to the methodology chosen here and as ambiguities may occur in the rock characterisation for the individual boreholes; the information in the geological database of the State of Berlin serves the purpose of a general geological survey and was not primarily compiled to assess the percolation performance of the top five metres and their layers. The project leader is therefore obliged to carry out on-site investigations, such as boreholes or percolation trials, prior to constructing a rainwater percolation facility.