Impervious Soil Coverage (Sealing of Soil Surface) 2021

Map Description

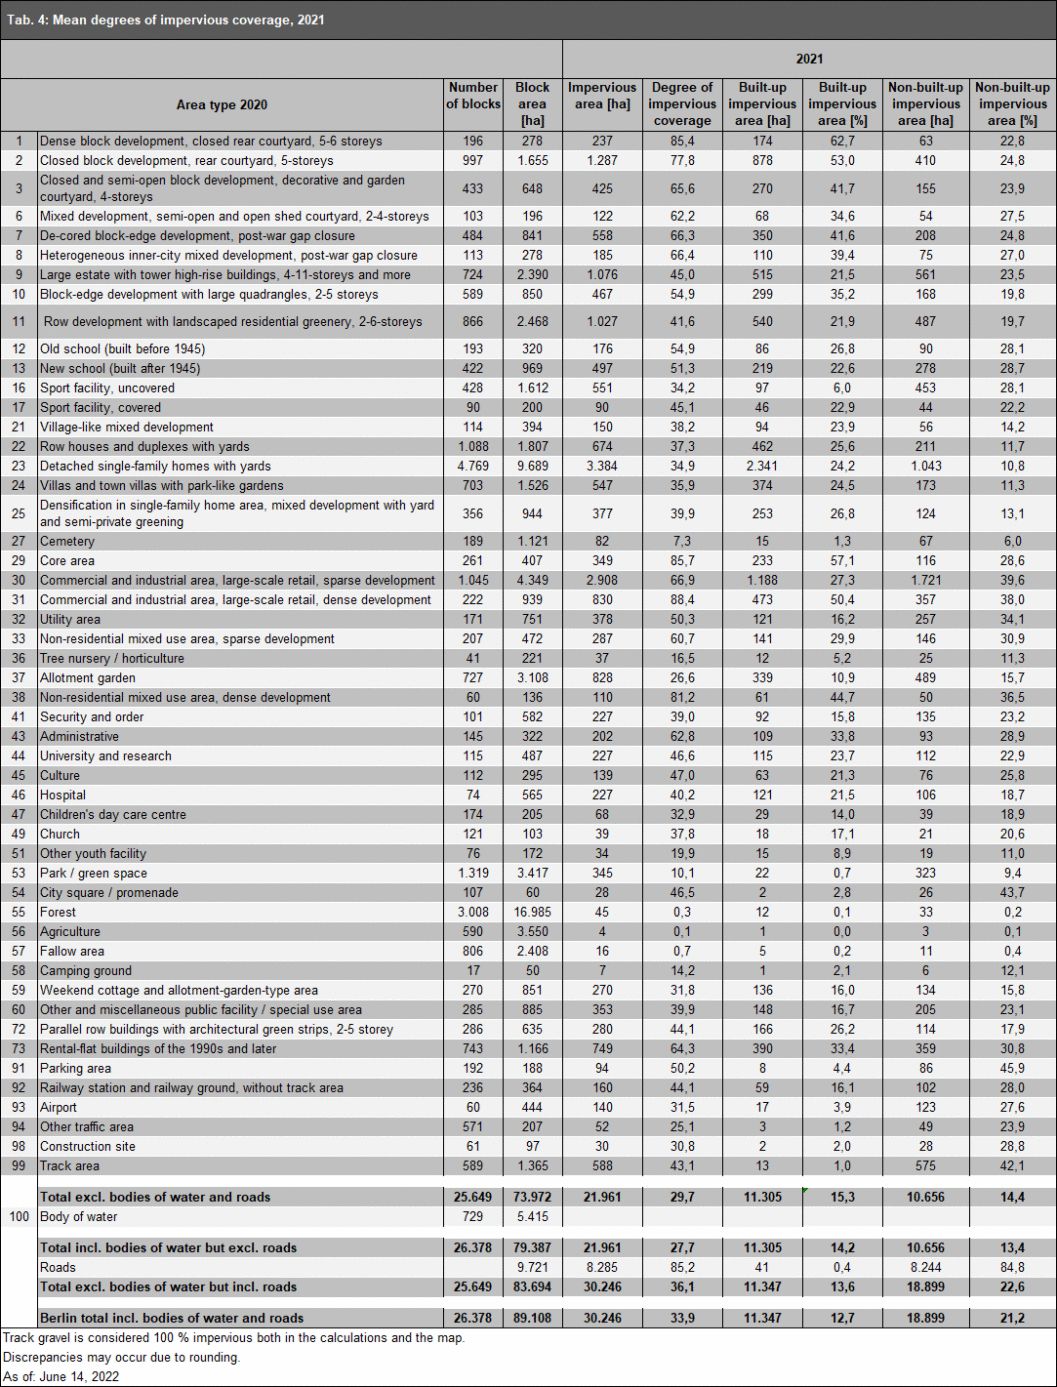
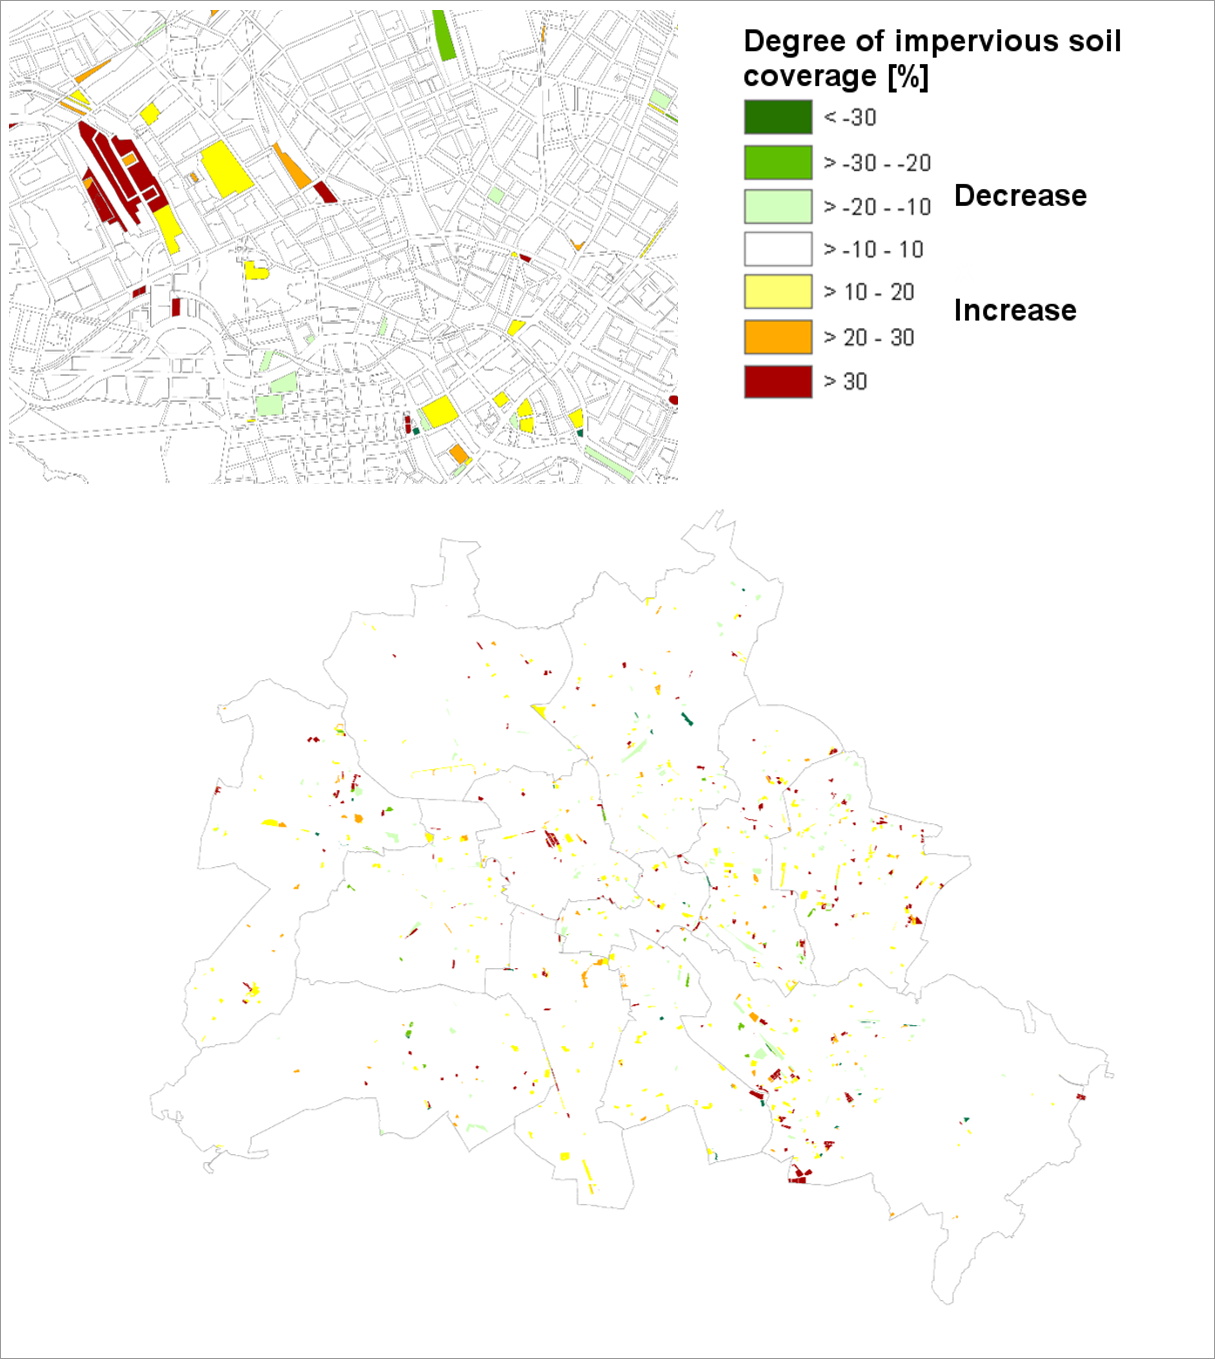
The map presents the degree of impervious coverage, i.e. the covering of the earth’s surface with impermeable materials, as a percentage of the reference area (block (segment) area or road section). Generally, the degree of impervious coverage, especially that of block (segment) areas, decreases from the city centre toward the outskirts, as the building structure becomes less dense, and the areas on the periphery are either completely undeveloped (forest or farmland), or characterised by single-family homes. Exceptions to this are traditional borough centres, such as those of Spandau and Köpenick, which were separate cities prior to 1920. Their degree of impervious coverage is about 60 % in general, and higher than 90 % in their core areas. Extensive areas occupied by large estates on the outskirts, such as Marzahn, Hellersdorf and Hohenschönhausen, or Gropiusstadt in Neukölln and the __Thermometersiedlung__ (“Thermometer Estate”) in Lichterfelde, are between 50 % and more than 80 % impervious. Commercial areas on the outskirts of the city, such as at Goerzallee in Steglitz or at Landsberger Straße in Mahlsdorf, also stand out due to a high degree of impervious coverage of more than 70 %. Table 4 presents the average degrees of impervious coverage of 2021 by area type in the following.

The area types “Dense block development, closed rear courtyard, 5-6 storeys” with 85.4 %, “Core area” with 85.7 % and “Commercial and industrial area, large-scale retail, dense development” display the highest overall degrees of impervious coverage at 88.4 %. The lowest degrees of impervious coverage, at below 1 % each, are listed for the area types “Forest”, “Agriculture” and “Fallow area”. A sharp increase in the degree of impervious coverage can be observed for the area type “Rental-flat buildings of the 1990s and later”. In recent years, new building projects were completed in many of these blocks (e.g. in __Europacity__, north of the __Hauptbahnhof__ (Berlin Central Station) or the __Rummelsburger Bucht__ (bay along river Spree)).

Tab. 4: Mean degrees of impervious coverage by area type, 2021

Tab. 4: Mean degrees of impervious coverage by area type, 2021

For a better overview, the degrees of impervious coverage are also summarised for each land-use type (ISU land use categories) (cf. Table 5). Residential areas display an average degree of impervious coverage of 43.4 %. Core areas have the highest mean degree of impervious coverage, with 85.7 %, while “Forest” and “Farmland” indicate the lowest degree of impervious coverage.

Tab. 5: Mean degrees of impervious coverage by land-use type, 2021

Tab. 5: Mean degrees of impervious coverage by land-use type, 2021

On average, 29.7% of Berlin’s block (segment) areas (excl. roads and bodies of water) are impervious. Of these, 15.3 % are built-up impervious areas, and 14.4 % are non-built-up impervious areas. Including bodies of water and road land in the calculation, 33.9 % of Berlin is impervious. Of these areas, 12.7 % are built-up and impervious, while 12.0 % are non-built-up and impervious. Berlin’s urban area contains 9.3 % of impervious road space. This means that one third of Berlin’s total area is impervious. About one third of this total impervious area consists of buildings, one third of roads and one third of non-built-up impervious areas.

Impervious Coverage in the Boroughs

The borough with the lowest degree of impervious coverage is Treptow-Köpenick, with 22.4 %, while Friedrichshain-Kreuzberg and Mitte have the highest degrees, with 68.1 % and 63.6 %, respectively. These two boroughs also have the highest shares of built-up areas, as a proportion of their total areas.

Fig. 4: Degree of impervious coverage of Berlin’s 12 boroughs and in total, 2021

The highly impervious road surfaces of pavement classes 1 and 2 (e.g. asphalt, concrete, plates and large-sized paving stones) occupy about two thirds (6,417 ha) of the total road space. Pavement types of groups 3 and 4 (e.g. small-stone and mosaic paving or grass trellis stones) that are slightly less impervious may only be found on about 11 % (1,110 ha) of the road space. Pervious road space, including traffic islands, green verges or pervious roads, allotment or forest paths, is represented by a percentage of 13.5 % (1,311 ha).

Fig. 5: Absolute area sizes of the road space pavement classes of Berlin‘s 12 boroughs

The road space in the inner city boroughs of “Mitte“, “Friedrichshain-Kreuzberg“ and “Charlottenburg-Wilmersdorf“ is particularly impervious. Pavement classes 1-4 (in shades of grey) occupy more than 85 % of the area.

With more than 10 %, the pervious green share of the road space is much greater in the outer boroughs of the city than in the inner-city areas. The borough of “Marzahn-Hellersdorf” stands out in particular here with a pervious share of more than 25 %. Wider roads, which are often accompanied by roadside greenery, and a larger number of pervious roads and footpaths as well as garden paths in the allotment gardens, concentrated on the outskirts of the city, may explain the large shares of pervious areas in the outer boroughs, if they are located outside the block (segment) area. The imperviousness of block (segment) areas is determined based on the method mentioned above.

Data on Impervious Soil Coverage of 2021 Compared with that of 1990, 2001, 2005, 2011 and 2016

Due to different survey methods, comparing the impervious coverage figures of the years 1990 and 2001 directly with those of 2005, 2011, 2016 and 2016 has its limitations. These figures are unsuitable for determining changes in the impervious area over the entire period of time (cf. Tab. 6).

In 2001, the degree of impervious coverage in amounted to 34.7 % in Berlin, including roads and bodies of water. This data is partially based on evaluations of satellite images as well as on other sources from the 1980s that only applied to West Berlin. In 1990, this mapping was extended to the area of East Berlin with the help of aerial photographs and topographic maps and partially updated in 2001. This also involved the use of flat-rate values for specific land uses. Overall, the survey method was inconsistent.

With the mappings of 2005, 2011, 2016 and 2021, data sets are now available that have been obtained using a uniform, automated and much improved procedure covering the entire area. Rather than presenting the impervious coverage numbers as they were determined at the time for each of those years, Table 6 presents adjusted figures for the first time. These were assigned retrospectively with reference to the improved data bases.

In 2021, Berlin’s degree of impervious coverage is 33.9 % (30,246 ha). In absolute terms, it has therefore only increased by 54 ha compared to the figure published in 2016. This slight increase does not reflect the true development, however, and must be corrected in two respects.

On the one hand, a decrease in impervious road space was detected that does not actually exist, based on an improved data basis. On the other hand, the calculated increase in built-up impervious areas since 2016 also requires a correction, as only about half of these areas, i.e. around 230 ha, may be attributed to actual new construction. With these constraints, around 550 ha of area (approx. 230 ha are built-up and approx. 330 ha are non-built-up impervious) must be added to the total impervious area of the block (segment) areas. This means that, in total, the impervious soil coverage actually increased by 0.5 % (approx.) between 2016 and 2021.

In-depth information on the developments is presented in the following:

Above all, the number of built-up impervious areas has increased steadily since 2005. This development is mainly the result of construction activity. However, some of the built-up impervious areas that have been recorded since 2011 were also included because of the improved building stock data. Overall, this has resulted in a more accurate delineation of shares of built-up and non-built-up impervious areas.

Tab. 6: Results of impervious coverage mappings in Berlin from 1990 to 2021 (all information refers to the total area of Berlin, incl. roads and bodies of water).

Discrepancies may occur due to rounding.
The figures from 1990 and 2001 are based on different evaluation methods, which do not allow a comparison with the figures from 2005, 2011, 2016 and 2021.

1) adjusted figures, more accurate delineation between built-up and non-built-up impervious areas based on improved data from 2016, adjusted impervious coverage based on improved data from 2021.

2) adjusted figures, more accurate delineation between built-up and non-built-up impervious areas, adjusted impervious coverage based on improved data from 2021.
As of: October 4, 2022

For the non-built-up impervious area, the picture is somewhat different. The apparent decrease by 2.8 % between 2001 and 2005 may be due to the fact that flat-rate values were assigned to the non-built-up impervious shares of some green and open-space categories (e.g. Forest and Agriculture) on the old maps for. These values have been recognised as having been set too high since then. These areas constitute a large share of the urban area. The degree of impervious coverage was hence overestimated for the non-built-up impervious areas in general. On the other hand, due to the interpretation of the satellite data, the new method rather underestimated the non-built-up impervious area. This makes more sense than there having been an actual reduction in impervious areas in the urban area. Since 2016, the proportion of non-built-up impervious area has increased slightly, which may be attributed particularly to a higher degree of impervious coverage in commercial and mixed-use areas.

Regarding the recording of the impervious road area, the rough estimates available in 1990 could only be replaced by figures provided by the then road construction administration in 1997. These were also used for analysis in 2001. For the impervious coverage mappings of 2005 and 2011, the degrees of impervious coverage determined for roads by borough were applied to the entire city based on 2006 data (Gerstenberg & Goedecke 2013). It certainly seems plausible that underground construction projects may have contributed to the slight increase in the degree of impervious coverage, primarily in East Berlin. As part of the 2021 impervious coverage mapping, the highly accurate area-specific road survey data was used for the first time. This was done to record the impervious coverage of road pavement types differentiated by referencing the attribute of the recorded material. This methodological change explains why the degree of impervious coverage has decreased for the road space, which did not, in fact, actually decrease. The new mapping method, no longer based on the mean degree of impervious coverage provided by road statistics, reflects a much more nuanced picture of reality. In Table 6, the degrees of impervious coverage determined in 2021 were therefore retrospectively adopted for 2011 and 2016.

Change Mapping of Impervious Coverage between 2016 and 2021

The fact that the same procedure was used in 2021 also permits a comparison with the impervious coverage at block (segment) level. Figure 6 maps the changes between 2016 and 2021 (the resulting map is also available in PDF format). The map highlights block (segment) areas that saw a change in impervious coverage of more than 10 % during this period. The overall balancing of all areas as well as all evaluations, however, also take into account changes below 10 % (cf. Tables 4, 5, 6).

In the following, some notable examples are described that serve to highlight case-specific reasons of why the degree of impervious coverage of some areas was mapped differently between 2016 and 2021.

A change in the degree of impervious coverage of 10 – 20 % was recorded in 345 block (segment) areas. In many cases, this is due to the retrospective densification of existing buildings or the completion of large-scale construction projects that were already partially completed in 2016. The area types “Row houses and duplexes with yards” (22), “Detached single-family homes with yards” (23), “Commercial and industrial area, large-scale retail, sparse development” (30) and “Rental-flat buildings of the 1990s and later” (73) are frequently affected. Furthermore, it is apparent that about 50 areas of the type “Park / green space” (53) show an increase in the degree of impervious coverage of 10 – 20 %. Either, more impervious areas, e.g. playgrounds, were added to such green spaces (e.g. in the __Kierzpark Schönagelstraße__ (park) in Marzahn or at Alarichplatz in Tempelhof). Or, based on less vital vegetation, the NDVI had changed to such an extent that it had an impact on the impervious coverage classes (e.g. Park an der Spree or at Lützowplatz).

A change in the degree of impervious coverage of more than 30 % usually indicates that a block (segment) area has either been redeveloped significantly or in its entirety. Notable large new construction projects include the aforementioned __Europacity__ north of the __Hauptbahnhof__ (Berlin Central Station), new commercial and residential developments in Mahlsdorf and Adlershof, the __Gartenstadt Karlshorst__, new rental-flat buildings at __Spandauer Seebrücke__ or the Tesla Center. Newly constructed temporary buildings, such as the shared housing on Wollenberger Straße (borough of Lichtenberg), also exhibit an increased degree of impervious coverage, although these buildings are not listed in the building stock. Their non-built up impervious proportion has therefore increased.

A strong decrease in the degree of imperviousness of more than 30 % is usually also caused by construction activity, as the affected areas are temporarily completely uncovered and therefore pervious after demolition (e.g. __An der alten Gärtnerei__ in Britz or Blockdammweg). If there is evidence of initial construction already on the aerial photograph, the non-built-up impervious area increases, as the new buildings are not yet listed in the building data base.

The following block (segment) areas are not included in the map due to limitations in comparability. The information may, however, be extracted from the factual data (564 areas):

  • Pseudo change, non-block area share >10 %: the ISU block geometry of 36 areas changed drastically between 2015 and 2020, i.e. in 2015, more than 10 % of the 2020 area was still mapped as road space, leading to pseudo changes in the impervious mapping.
  • Pseudo change, improved data base, buildings: the improved data base for the building stock (NOT-ALKIS) has not led to actual but to pseudo changes for 24 block (segment) areas. This mainly affects allotment garden facilities and areas characterised by single-family homes.
  • Pseudo change, track: the improved data base for railway tracks (K5) as well as differences in the characteristics of the narrow track geometries between the grid analysis of 2016 and 2021 have led to pseudo changes in 234 block (segment) areas.
  • Pseudo change, phenology: the satellite image scenes used for the impervious coverage mappings of 2016 and 2021 were not recorded on the same day, i.e. the vegetation was not at the same stage of development. For 2021, a scene recorded on June 7 was used in which the vegetation is more advanced in some places than in the scene from May 2, 2016. Since the degree of impervious coverage is derived from the NDVI for the non-built-up impervious areas of some area types, more developed vegetation is accompanied by a decreased degree of impervious coverage. This does not represent an actual use change and led to pseudo changes in 101 areas.
  • Pseudo change, corrections of the 2016 analysis: mapping errors were detected in 28 areas of the 2016 analysis, which were corrected in the current mapping and led to pseudo changes for the areas in question.
  • Pseudo change, 2015 land-use correction: for 106 areas, the use attributes were corrected without an actual change in use having taken place since 2015. A change in green-space use or area type then changed how the degree of imperviousness was assigned during the mapping process. For fallow areas, for example, all areas with a degree of vegetation of more than 5 % received a degree of impervious coverage of 0 % by default. For park areas, on the other hand, the degree of impervious coverage is assigned gradually, based on the degree of vegetation and how developed it is (cf. final report, NDVI categories, only in German).
  • Pseudo changes, incorrect building data base of 2021: in 35 cases, there were pseudo changes due to the 2021 building data base containing errors, which was particularly the case for block (segment) areas with railway use. A reason for this is the fact that the ALKIS building dataset does not include all railway station buildings and that the NOT-ALKIS buildings are not applied for areas with railway use.
Fig. 6: Map of changes of impervious coverage between 2016 und 2021, top left section: area around the Hauptbahnhof (Central Station) with Europacity

Fig. 6: Map of changes of impervious coverage between 2016 und 2021, top left section: area around the Hauptbahnhof (Central Station) with Europacity

(the result is also available in PDF format, only in German)