General
The maps present the temperature distribution in the subsoil for five different depths, i.e. the reference horizons 20 m, 40 m, 60 m, 80 m and 100 m below terrain surface in the State of Berlin. They also show the average temperatures for depths from 0 m to 50 m and 0 m to 100 m. It should be noted that the isothermal lines may be rather inaccurate, depending on the density of the existing measuring points.
The map information on temperature distribution should be used in cases where no representative temperature measurements are available for the site. It should be noted that the results of a temperature measurement apply to the recorded depth profile only. Depending on the variability of the site characteristics, other conditions may well prevail only a few hundred metres away, which could lead to changes in the temperature of the subsoil. Without taking these changes into account, applying the data even to a site very close to the measurement point could seriously distort the assessments of temperature conditions. In general, however, the maps presented may be used to obtain initial insight into the temperature conditions of a site and its potential use for geothermal energy.
The influence of bank filtrate in the vicinity of multiple well galleries of the Belin waterworks (__Berliner Wasserbetriebe__) on the near-surface temperature field was found to be substantial. Due to seasonal temperature fluctuations of the surface waters, measuring points located between production wells and surface waters are particularly influenced. For this reason, these measurements were disregarded during map development.
Temperatures 20 m below terrain surface
The current temperature distribution (measurements from 2020) shows considerable differences compared with the previous edition of the map from 2015 for the reference horizon 20 m below terrain surface (Map 02.14.1). This is due to the fact that a lot more measuring points, especially in the east of the city area, were used to determine the temperature distribution, among other things.
Generally, temperatures tend to increase from the outskirts of the city towards the city centre. In the north-east, the temperature development is characterised by a continuous temperature increase moving towards the city centre, while multiple smaller positive and negative temperature anomalies occur in the rest of the city.
A contour line of 12.5°C encircles the densely built-up city centre with its highly impervious surfaces 20 m below terrain surface (Map 02.14.1). The heat island located in the city centre has temperatures of more than 12.5°C and is interrupted by the Großer Tiergarten, a large green space in the centre of the city. Temperature anomalies exceeding temperatures of 14.5°C may be observed within this heat island.
Outside of the city centre, positive temperature anomalies also correlate with highly impervious areas, such as secondary centres and industrial areas.
Below the extensive woodlands in the south-eastern, northern and north-western outskirts of the city, as well as in the Grunewald area, temperatures are below 10.5 °C. Some temperature anomalies with less than 11.5°C occur in the urban area, such as the Britzer Garten, Tempelhofer Feld or Jungfernheide. These areas have a high proportion of vegetation. A reason for the number of negative temperature anomalies that have now been detected/ proven, in contrast to that of the previous map edition from 2015, is the higher density of measuring points. In general, the groundwater temperature in the densely populated inner-city area is more than 5 K higher than that of the surrounding areas.
Temperatures 40 m, 60 m, 80 m and 100 m below terrain surface
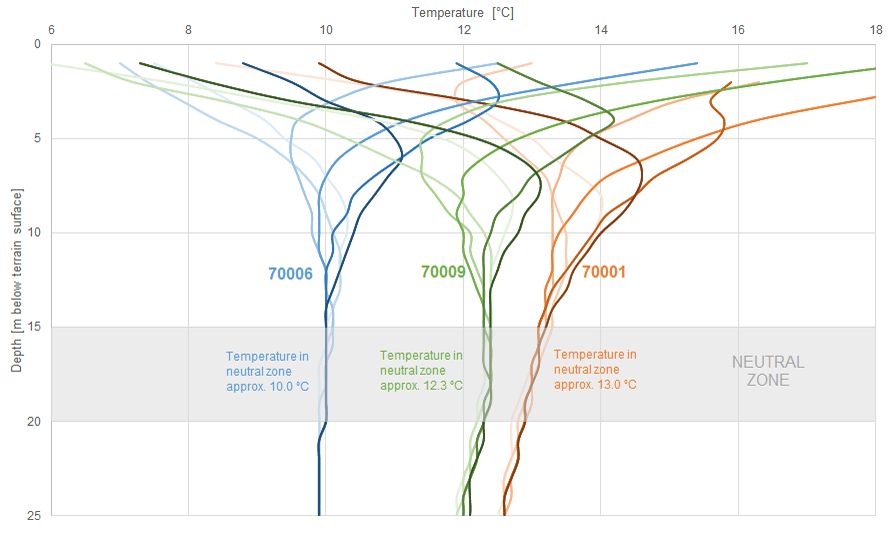
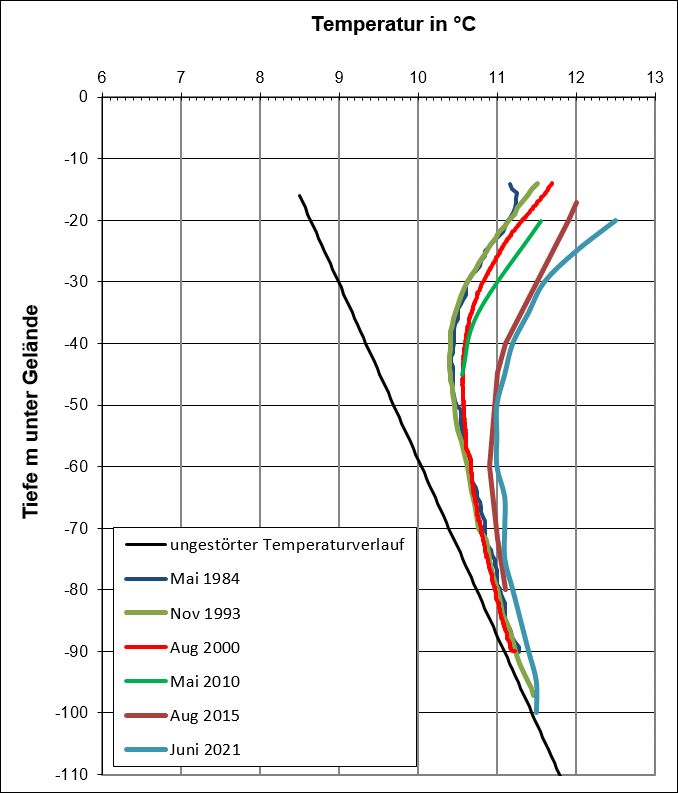
The other maps (02.14.3 – 02.14.6) show the groundwater temperature distribution for the reference horizons 40 m, 60 m, 80 m and 100 m below terrain surface in the State of Berlin. At these depths, daily and seasonal fluctuations can be ruled out. However, long-lasting and, for example, anthropogenic changes in temperature, that may have been caused by changes in building development or the climate, may manifest themselves at these depths.
Such temperature anomalies can be observed particularly in the inner-city areas in the borough of Mitte, but also at the southern edge of the city, in Berlin Lichterfelde along the Teltowkanal, with a history of construction use and intensive industrial use (groundwater temperature distribution for the reference horizons of 80 m and 100 m).
Other temperature anomalies, such as those in the south-west of Berlin on the border with Potsdam, in the northern portion of the Grunewald forest, in the area of the natural gas storage area, and in Lübars, on the northern border of Berlin, are linked to geological structures in the deeper subsoil. These temperature anomalies are assumed to be connected to the salt dome structures in the deep subsoil that exist in the Berlin area.
The presented temperature distributions in the deeper subsoil at more than 80 m below terrain surface, e.g. in the boroughs of Lichtenberg, Marzahn and Hellersdorf in the east of Berlin, may be rather inaccurate, due to the small number of measurements available.
Average temperature 20 m to 100 m below terrain surface
In addition to the groundwater temperature distribution maps covering the different reference horizons, another map was developed focussing on average temperatures at depths between 20 m and 100 m. This map may also be used as a tool in the design of geothermal plants.
The map reveals that the densely built-up inner-city area in particular exhibits average temperatures of more than 11 °C. The average temperature is approx. 10 °C in the outer boroughs, and approx. 9°C in the non-built-up periphery.
In the context of this map, it should be noted that the average temperatures presented may deviate to a small extent, due to local climatic conditions and the density of measurement points. For example, the average temperature may be lower in areas with a lot of vegetation, whereas it may be higher in areas that are largely impervious.
Summary
In summary, it was found that the groundwater temperature may more than 5 K higher in the densely populated inner-city area compared to the non-built-up surrounding areas. There is a clear connection between groundwater temperatures and the urban climatic conditions above ground. Regular measurement results at temperature measuring points, which are located in areas with different urban structures, prove this further.
In general, the groundwater temperature distribution near the surface is directly related to the land use in the State of Berlin. The influence of industrial settlements, larger buildings, waste heat producers, impervious soil coverage, and anthropogenically heated surface waters is clearly reflected in the temperature distributions. These aspects have a major influence on the temperature change in the subsoil. It was also demonstrated that green spaces cause negative temperature anomalies in the subsoil, which then contribute to lowering the temperature of the subsoil and to counteracting further temperature rises.
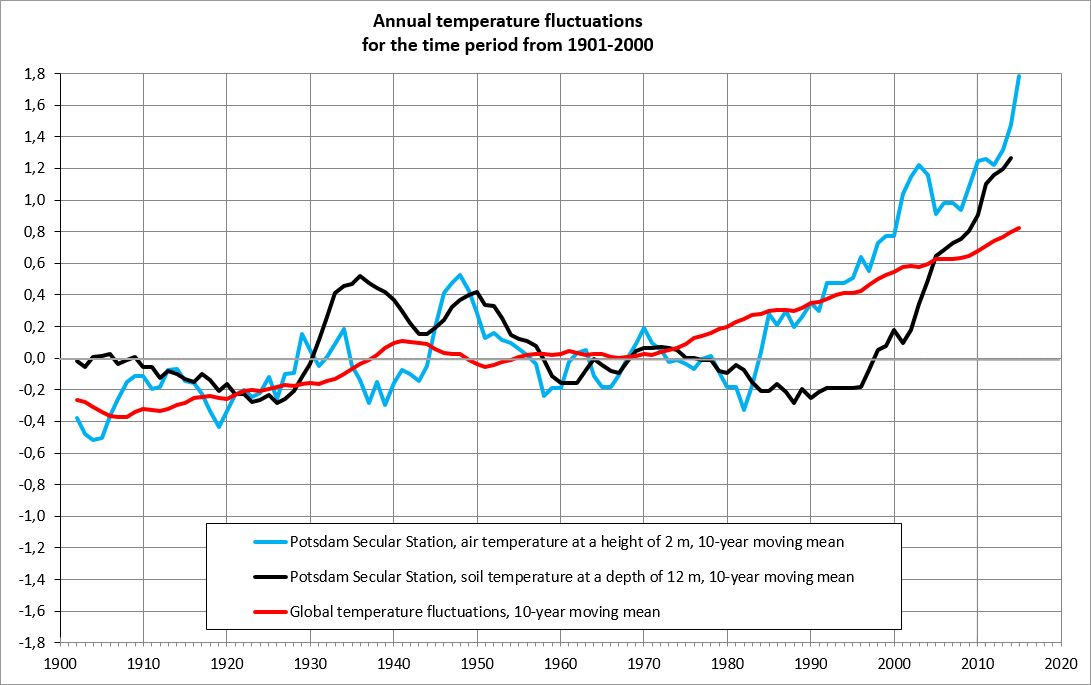
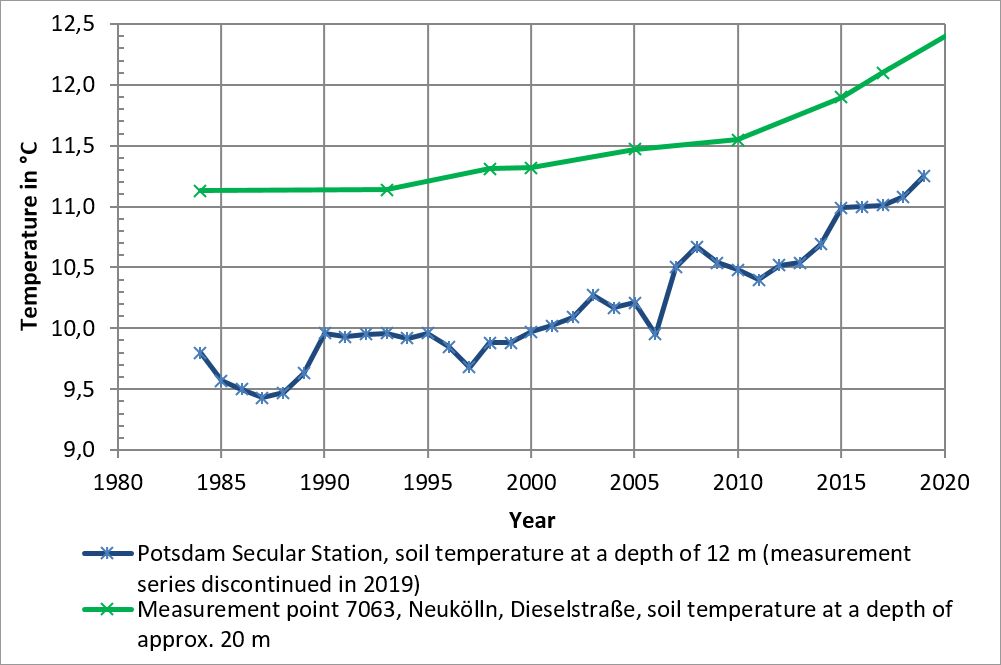
The results of long-term studies indicate that, based on the progressing building development and the global climate change, it seems inevitable that the temperature of the subsoil near the surface as well as the groundwater will continue to rise substantially.