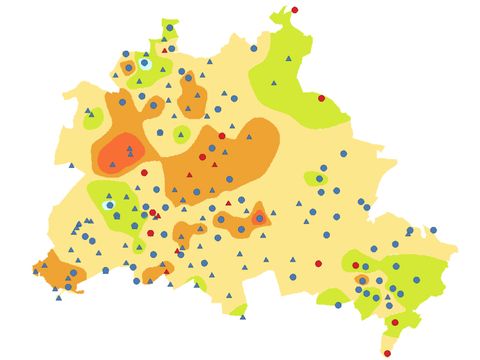
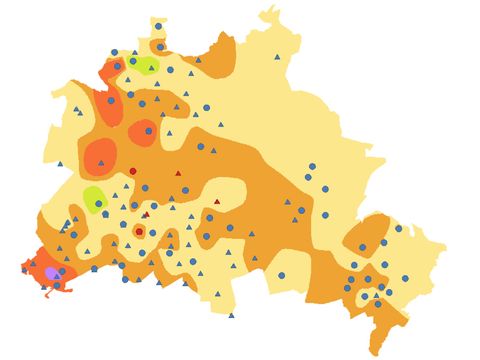
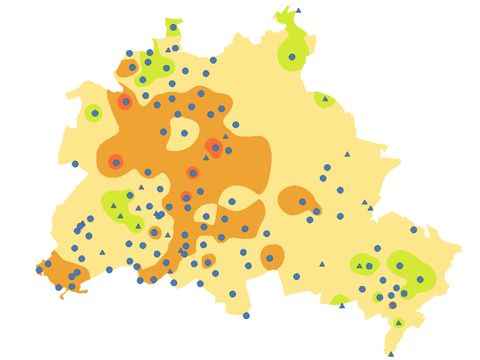
Groundwater Temperature 2020

Maps

Vorschau

02.14.1 Groundwater Temperature 20 m Below Surface

The map presents the groundwater temperature distribution for the reference horizon 20 m below the surface. Differences to the 2015 map, some of which are substantial, may be attributed to the considerably higher number of measuring points that were used in the process, among other things. 02.14.1 Groundwater Temperature 20 m Below Surface

Vorschau

02.14.2 Groundwater Temperature 40 m Below Surface

The map presents the groundwater temperature distribution for the reference horizon 40 m below the surface. Differences to the 2015 map, some of which are substantial, may be attributed to the considerably higher number of measuring points that were used in the process, among other things. 02.14.2 Groundwater Temperature 40 m Below Surface

Vorschau

02.14.3 Groundwater Temperature 60 m Below Surface

The map presents the groundwater temperature distribution for the reference horizon 60 m below the surface. Differences to the 2015 map, some of which are substantial, may be attributed to the considerably higher number of measuring points that were used in the process, among other things. 02.14.3 Groundwater Temperature 60 m Below Surface

Vorschau

02.14.4 Groundwater Temperature 80 m Below Surface

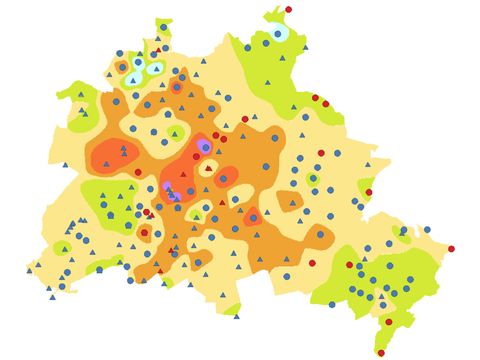
The map presents the groundwater temperature distribution for the reference horizon 80 m below the surface. Differences to the 2015 map, some of which are substantial, may be attributed to the considerably higher number of measuring points that were used in the process, among other things. 02.14.4 Groundwater Temperature 80 m Below Surface

Vorschau

02.14.5 Groundwater Temperature 100 m Below Surface

The map presents the groundwater temperature distribution for the reference horizon 100 m below the surface. Differences to the 2015 map, some of which are substantial, may be attributed to the considerably higher number of measuring points that were used in the process, among other things. 02.14.5 Groundwater Temperature 100 m Below Surface

Vorschau

02.14.6 Average Temperature of the Groundwater 20 m - 100 m Below Terrain Surface

The map on average temperatures for depths ranging from 20 m to 100 m serves as a tool for designing geothermal plants. Average temperatures of more than 11 °C occur in the densely built-up inner city area. Average temperatures range between approx. 10 °C in the outskirts and 9 °C in the non-built-up periphery. 02.14.6 Average Temperature of the Groundwater 20 m - 100 m Below Terrain Surface