The map shows the degree of sealing, i.e., the surface coverage with impermeable materials as a percentage of the reference surface.
For a detailed methodological description, see (Methodology, 1993 Version).
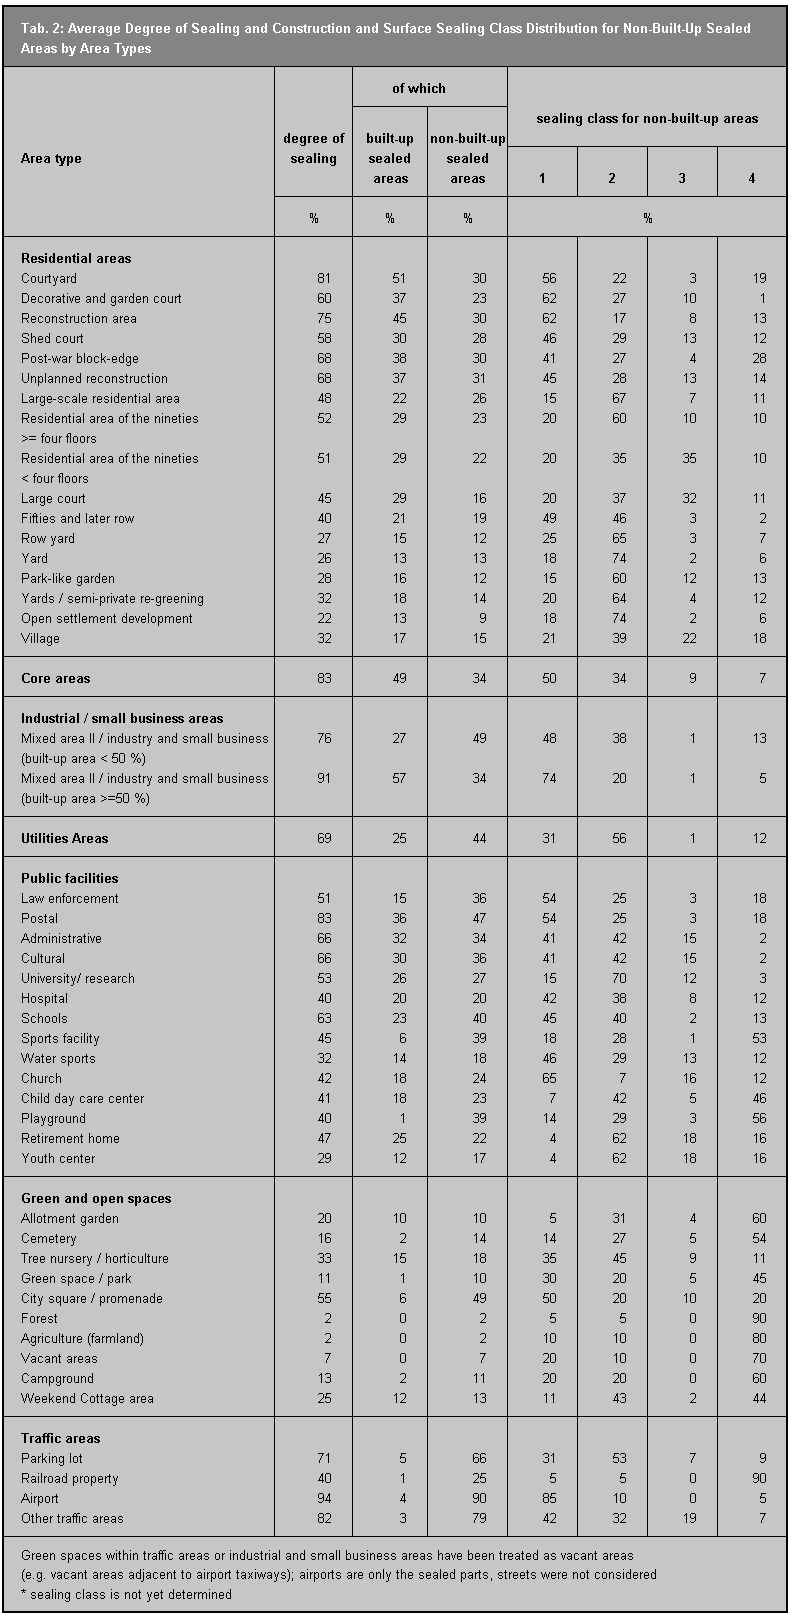
On the basis of the stated data sources, the degree of building (coverage with building structures) per block area and the share of non-built-up sealing were ascertained. The addition of those two quanta yields the degree of sealing for a block area, i.e., 100% of the non-built-up sealed proportion is used to determine the overall degree of sealing.
That explains, for example, the degree of sealing of railway areas, 73%, which appears very high at first glance, but consists of 7% buildings and 66% non-built-up sealed areas. Moreover, 90% of the latter were assigned to Surface Class 4, the “most permeable” category (see Surface Classes).
Since the degree of building is the quantum that can be ascertained more exactly, the information on the degree of sealing has a tendency to be more precise the higher the share of the built-up area is. Terrestrial random sampling surveys were carried out to provide a statistical safeguard for the data.
For the use categories Woodlands and Agriculture, a degree of sealing of 2, or 2%, was automatically assigned; for Ruderal Areas, this was 7%, and for parks 10%. In these cases, the actual degree of sealing was ascertained if the recognizable degree of sealing differed considerably from the degree to be assigned. For roadways and railway areas, no degree of sealing is shown on the map.
The ascertainment of the degree of sealing was carried out only for areas of a minimum size of one hectare; for linear area structures, a minimum width of 20 meters applies.
All information on sealing is administered and processed by the City and Environment Information System (ISU). The ISU’s Basic Digital Topographical Map in a scale of 1:50,000 (ISU 50) serves as a spatial reference system. There, each statistical block, which is as a rule delimited by streets, is shown with its block number. The numbering and delimitation of the blocks are managed by the State Statistical Agency. The smallest data surface is the block segment, which is delimited on the basis of differing utilization within a statistical block.
For the present Map, 24,690 block areas have thus been defined. The representation is generalized and not true-to-location. Streets have no area in the ISU spatial reference system, and can therefore not be referenced for data purposes. The course of the roadways emerges from the boundaries between the statistical blocks.
Surface Classes
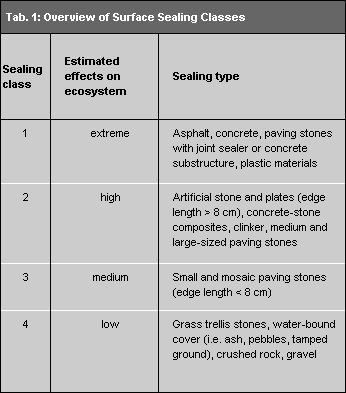
In order to ascertain the effects of sealing on the ecosystem in as great detail as possible, various angles of perspective are conceivable. The climatic impact, for example, can be interpreted better if it is known whether the sealed areas are built-up or non-built-up, and how high the buildings are. A special analysis of the effects on the new groundwater formation and the drainage behavior of precipitation has resulted in the realization that all artificial surface coverings do not have the same environmental impacts. Thus e.g. a broad-seamed mosaic pavement is much more permeable to water than a concrete-sealed surface, and a parking lot paved with lawn pavers has a different micro-climatic effect than an asphalt parking lot.
The available types of surface covering have been grouped into four surface classes with different effects on the ecosystem. (cf. Tab. 1).


