Urban Structural Density 2019

Map Description

Values determined for the FSI and SOI maps are classified based on the classification of the land use plan (FNP) and the building use plan (BNP). Areas with negligible levels of development were assigned to the undeveloped areas and presented with them. These are areas with a site occupancy index (SOI) of below 0.1 or a floor space index (FSI) of below 0.05. These are usually forest areas or similar open spaces containing only one or a few buildings, typically outbuildings.

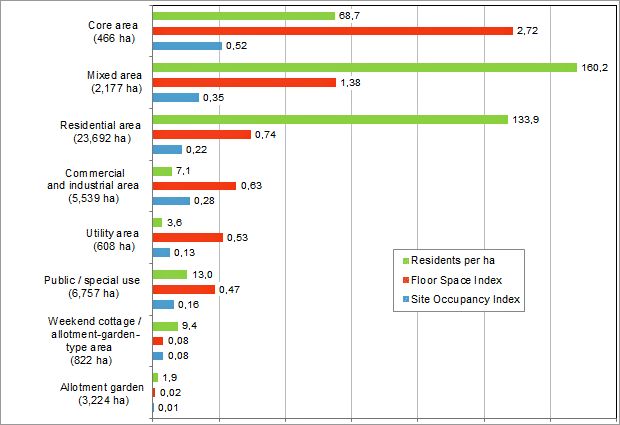
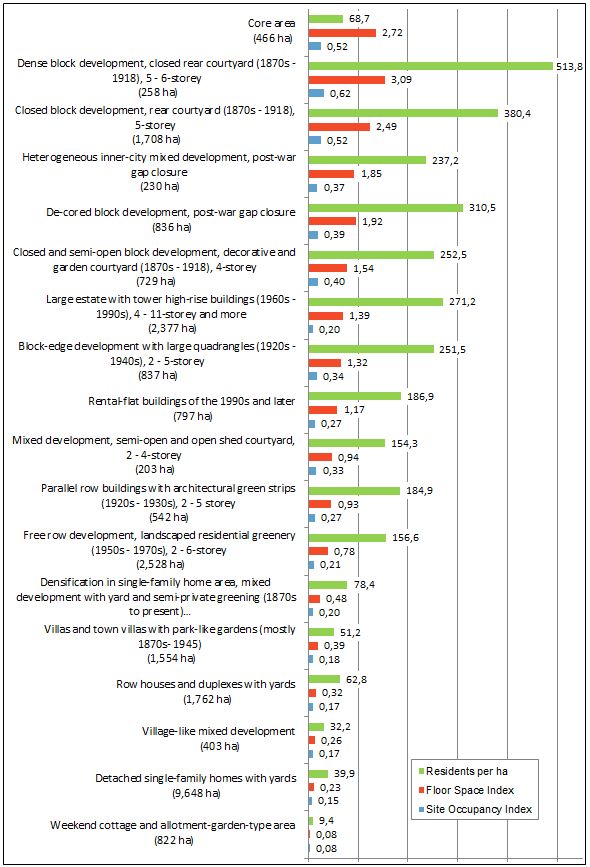
As expected, the maps generally depict a largely concentric staggering of the degree of structural use in the municipal area and, to a large extent, a strong link with the Environmental Atlas Map Building Age in Residential Development (06.12). The more densely built-up areas are easily recognisable by their dark red and dark blue colouring. Today’s inner-city area within the City Rail Circle Line, built as the “Wilhelminian tenement belt” around the old centre of Berlin, has the highest structural density even today, with FSIs of between 2 and 4. This is also true of the “new city centre” at Potsdamer Platz and the core areas of the boroughs of Spandau, Reinickendorf, Köpenick, Hellersdorf and Zehlendorf.

On the periphery of the inner city, including many residential areas of the Weimar period, most areas have an FSI of 1.0 to 1.2. In the outer parts of the city, single-family homes prevail, with low floor space indices of less than 0.5 predominating. The large housing estates of the ’60s and ’70s, and older built-up areas along the main radial traffic routes stand out clearly, as they use their grounds to a greater extent. In particular cases, a high density of development of individual blocks can be seen even in the peripheral areas of the city. This usually involves large public service complexes, such as the hospital complex in Berlin Buch.

The considerably higher density figures of the numerous local centres also show the polycentric structure of Berlin with its core area uses.

The maps may be used to locate building land reserves in built-up blocks in which the actual degree of structural use is less than what is permissible under building law. These reserves play an important role in urban development discussions about the densification of the inner city.

Fig. 3: Population density, FSI and SOI of select use categories in comparison (area-weighted calculation), ALKIS building stock, March 2019.

Fig. 3: Population density, FSI and SOI of select use categories in comparison (area-weighted calculation), ALKIS building stock, March 2019.

Fig. 4: Population density, FSI and SOI of the different urban structure types in comparison (area-weighted calculation), ALKIS building stock, March 2019.

Fig. 4: Population density, FSI and SOI of the different urban structure types in comparison (area-weighted calculation), ALKIS building stock, March 2019.

Figures 3 and 4 show the average FSIs and SOIs for select use categories and urban structure types, and contrast them with the average population densities. When comparing the population density with the two parameters “site occupancy index” and “floor space index”, it is clear that the greatest population densities combined with the highest urban structural densities, remain in the neighbourhoods with Wilhelminian block developments (cf. Fig. 4). Satellite towns and high-rise complexes, on the other hand, tend to be in the mid-range due to large undeveloped spaces between individual buildings.

Fig. 5: Population density in proportion to the average number of storeys per block (only blocks with residential use, area-weighted calculation), ALKIS building stock, as of March 2019.

Fig. 5: Population density in proportion to the average number of storeys per block (only blocks with residential use, area-weighted calculation), ALKIS building stock, as of March 2019.

Fig. 5 shows the ratio between the number of storeys and population density of the 12,614 blocks identified as residential areas, core areas, or mixed areas, according to the use categories of the Environmental Atlas maps Actual Use of Built-up Areas (06.01) and Inventory of Green and Open Spaces (06.02). Ultimately, due to its high building density of 340 residents per hectare, the structure type representing the 5 – 6-storey block development of the Wilhelminian period with wings and rear buildings, stands out. This value is only exceeded by areas with tower high-rises of more than 10 storeys in the sequence presented. In the structure type “post-war high-rise development”, the large undeveloped spaces between the buildings are compensated by the high number of residents per building.