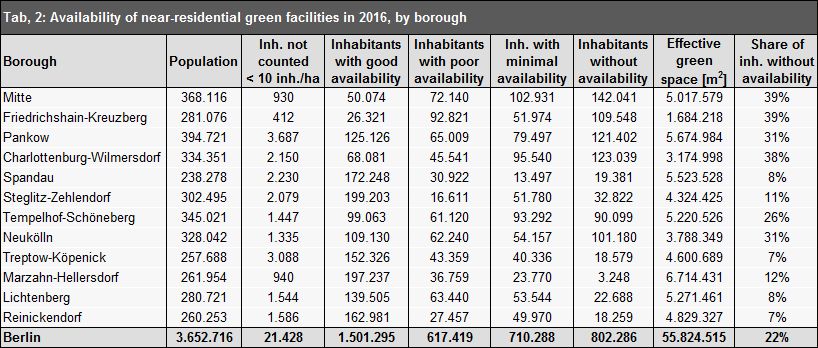
The table shows the populations of the boroughs of Berlin as used for the calculation process; their total populations; the number of residents not considered, i.e., in the blocks with population numbers below the threshold of 10 inh./ha. The remaining columns distinguish between the four degrees of availability ranging from “with good availability” to “without availability” and the inhabitants that fall into these categories (cf. Calculation of the Degree of Availability). “Inhabitants without availability” refers to those people, who, according to the availability analysis, do not have access to suitable green space close to their homes.
Inner City Areas
The map shows the detailed situation of availability of green space, by block. As is to be expected, an especially poor situation exists with respect of the availability of green space in the inner city areas with block development from the Wilhelminian period.
Generally, closed block development prevails in these inner city neighbourhoods. Core areas characterized by a low level of private and/or semi-public open spaces also have high structural density. In these areas, serious open-space deficits exist, both in the private and in the public sector.
In the inner city, small green spaces isolated from one another prevail. They are often designed as city squares, and can thus come nowhere near to covering the need for near-residential green space caused by high population density.
Outlying Boroughs
In the outlying boroughs, the situation is generally better. The available green spaces are frequently large; in some cases, forest areas are directly adjacent to residential areas. Due to the less dense development structure, the population density is considerably lower.
As a rule, the level of private green space is relatively high in the outlying boroughs, because of the prevailing single-family and/or row house development, so that deficits in public open space are partially compensated.
The situation is different for the major residential estates at the outskirts of the city, which are characterized by tower high-rises or chains of high-rises. While in Marzahn and Hellersdorf, the open areas of the Wuhle valley and the Hönow chain of ponds largely provide availability of green space, considerable deficits exist in the Märkisches Viertel and Gropiusstadt areas. The shortage of public green spaces there means that an undersupply exits, despite large residential courtyards and connections to the Lübars Recreational Park and the Rudow Grove, respectively.
Availability development between 2011 and 2016
Since 2010, Berlin has seen a population growth of about 300,000. Based on this substantial increase, the state’s number of inhabitants amounts to 3,690,000 today (June 30, 2017). Berlin’s population, however, has not been growing evenly across the individual boroughs. Increases rather vary between almost 50,000 additional inhabitants in Mitte as compared to about 14,000 in Steglitz-Zehlendorf (Statistical Office of Berlin-Brandenburg 2017).
If these new inhabitants are not provided with access to newly built parks as part of compensatory measures, the availability of near-residential public green spaces in the boroughs decreases to a some extent. Densification measures within blocks also reduce the share of private and semi-public open spaces in residential areas.
The map of changes from 2011 to 2016 (PDF; 12.8 MB), shows availability increases/ decreases for each block or block segment area by 1, 2, or 3 categories. The grey categories “Analysis excludes 2011” and “Analysis excludes 2016” indicate block or block segment areas, which failed to meet the analysis limit of 10 inhabitants/ha for the year in question.
The map shows that only a relatively small number of areas throughout the city have seen a change in availability. Changes by one availability category prevail, however, some areas are affected by major changes. The availability change that can be seen in the Klixstraße planning area, and more specifically in the Reinickendorf/ Borsigwalde region, is based on the Green-Space Information System (GRIS) now listing the Wackerweg allotment gardens as a public green space. This increased availability, is regarded as limited, however, as the allotment garden paths have few recreational qualities only.
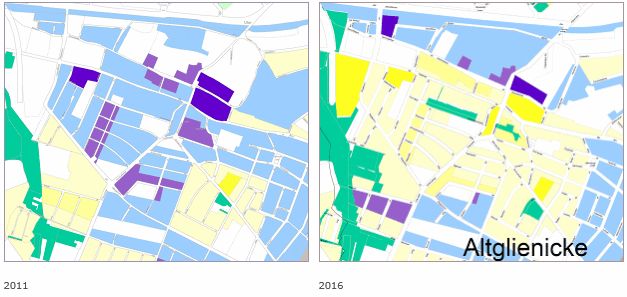
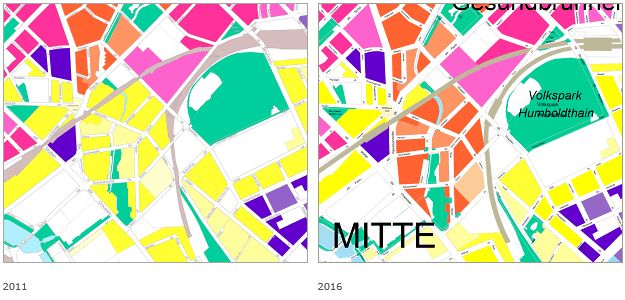
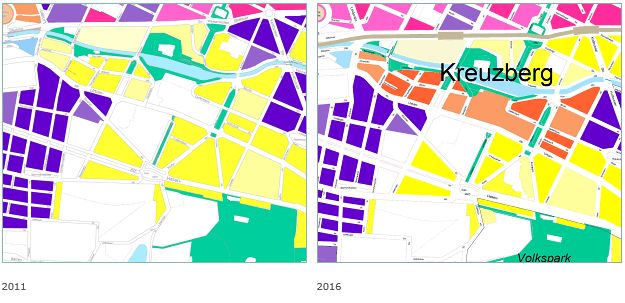
Both the positive effects of creating a new park, as well as decreases in availability, will be detailed in the following three examples: