Traffic-related Emissions and Immissions 2009

Map Description

Map 03.11.1 Auto Traffic Emissions, 2009

Generally, the transport-related emissions are primarily determined by the number and composition of the vehicle fleet, the lorry share, vehicle speed, the susceptibility of a particular road section to congestion, and the average specific emissions of the vehicles.

The primary roads have to cope with much of the traffic load in urban areas. Although the primary road network of Berlin shown on the map, with its length of approx. 1,380 km, accounts for only about 25 % of the total network of about 5,410 km, the major share of all mileage travelled, and of traffic-related emissions, occur on this segment of the network (in both cases over 80 % of the total).

While Table 4 contains the individual totals, the map shows the spatial distribution among the approx. 8,330 count sections.

All 945 sections with – in Berlin terms – “well above average” emissions of the pollutants NOx and PM10 have an “average daily traffic volume” (DTV) of more than 20,000, each with a lorry share of well above 10 %. Especially the heavier ones, those > 3.5 t, due to their powerful engines, account for a disproportionately large share of motor vehicle-related emissions (e.g. up to 75 % of soot particles).

Assignment to one of the four emissions classes does not allow direct conclusions to be drawn regarding the pollution/immissions situation in the respective section. For this purpose, separate calculations for concentrations of major substances are carried out, which take into account such necessary marginal factors as meteorology, as a non-constant quantum, and the particular route environment (see Methodology section). The calculation model provides an estimate of the concentration of pollutants within the street canyons, in areas in which people are likely to be present not only temporarily.

The sections of this evaluation level are predominantly such main roads as

  • Parts of the city motorway A100
  • Federal roads, such as Heerstraße or Potsdamer Straße
  • Other important connecting routes, such as the routes Großer Stern – Kaiserdamm/Großer Stern – Martin-Luther-Straße, or the Leipziger Straße – Gruner Straße – Otto-Braun-Straße corridor.

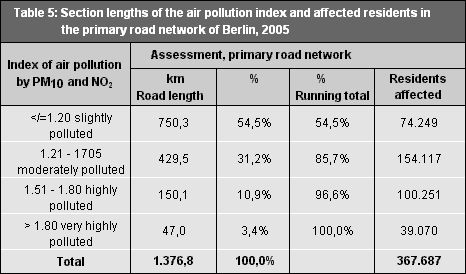
Map 03.11.2 Index of air pollution for PM10 and NO2 in 2009

Measurements of the concentrations are only representative for a limited area around the measurement station, and particularly for the particulate PM10, strongly dependent on meteorological conditions.

These dependences are elucidated by the following depictions in Figures 10 to 13.

The trend of PM10 daily mean values in 2002, 2005, 2007 and 2010, at the measurement stations of the BLUME measurement network

Fig. 10: 90.41 % value of particulate concentration PM10 [µg/cu.m.] in 2002 at the measurement stations of the BLUME measurement network

Fig. 10: 90.41 % value of particulate concentration PM10 [µg/cu.m.] in 2002 at the measurement stations of the BLUME measurement network

Fig. 11: 90.41 % value of particulate concentration PM10 [µg/cu.m.] in 2005 at the measurement stations of the BLUME measurement network

Fig. 11: 90.41 % value of particulate concentration PM10 [µg/cu.m.] in 2005 at the measurement stations of the BLUME measurement network

Fig. 12: 90.41 % value of particulate concentration PM10 [µg/cu.m.] in 2007 at the measurement stations of the BLUME measurement network

Fig. 12: 90.41 % value of particulate concentration PM10 [µg/cu.m.] in 2007 at the measurement stations of the BLUME measurement network

Fig. 13: 90.41 % value of particulate concentration PM10 [µg/cu.m.] in 2010 at the measurement stations of the BLUME measurement network

Fig. 13: 90.41 % value of particulate concentration PM10 [µg/cu.m.] in 2010 at the measurement stations of the BLUME measurement network

The daily mean value of particulate concentration PM10 of 50 µg/cu.m, corresponding to the value 90.41%,may not be exceeded on more than 35 days a year.

Evaluations of the causes of particulate pollution show that approx. half of the particulate concentration in near-traffic measurement points in central Berlin stem from sources outside the Berlin area. Depending on the process of meteorological conditions, this external influence can lead to a more or less strong exceedance, particularly of the second PM10 limit value. No more than 35 exceedances of a daily mean value of 50 µg/cu.m of particulate PM10 are permitted.

While the short term limit value in some cases considerably exceeded in 2002 and 2005, according to measurements (e.g. 2005: 82 exceedances at the Frankfurter Allee measurement station), in 2007, favourable meteorological conditions, with a large number of west wind weather situations causing a high degree of air exchange, caused not only the mean annual value to be met at all measurement stations for the first time, but the results also were below the second limit value. In 2010, another year with adverse meteorological conditions, the PM10 limit value was met in terms of the annual average of 40 µg/cu.m. at all stations. However, the same year 90.41 % value was exceeded at all street measurement stations, and also at the urban background monitoring station in Neukölln; at the BLUME Station 124 on Mariendorfer Damm, this in fact occurred more than 20 times.

However, this proven external influence on the particulate concentration does not provide any excuse to fail to make an effort locally to ensure the permanent reduction in PM10 pollution.

In order to permit a long-term reduction of particulate matter, even with adverse weather conditions on major roads, the Berlin Air Quality and Action Plan for 2005-2010 was drafted; one of its measures was the introduction of the Environmental Zone as of Jan. 1, 2008, which has led to a long-term reduction in air pollution. In 2010, the number of exceedance days would, without the Environmental Zone, have in any case exceeded 50 µg/cu.m. on 10 more days.

For a complete and up-to-date picture of the existing pollution and the distribution of pollutants in the municipal area beyond the information obtained from the BLUME measurement stations, elaborate model calculations were carried out in 2009 in the context of the new survey of motor vehicle traffic under the revised Air Quality Plan for 2009-2020, as described above in detail in the chapter on Methodology, with reference to the canyon streets. These were based on weather conditions and traffic and emissions data from 2009.

The municipal background PM10 pollution for the exemplary year 2009 is shown in Figure 14; it shows a noticeable increase in values as one moves from the outskirts towards the city centre, i.e., the area within the urban rail (S-Bahn) Circle Line (the “Big Dog’s Head” – so-called for the line’s shape on the map).

The concentration calculated for the inner city of between 25 and 27 µg/cu.m. is representative for the pollution in residential areas with low traffic and a considerable distance from industrial plants.

Fig. 14: PM10 pollution (annual mean) in the Berlin municipal background, calculated with IMMISnet and measured at BLUME measurement stations for the base year 2009

The calculation of the PM10 and NO2 immissions shown on the map was carried out on the primary road network using the IMMISluft model, complemented by a detailed data display for each road section assessed. This results from the overlaying of the respective concentration in the municipal background and the calculated additional pollution from local traffic in the respective section of each major road.

All road sections shown in purple show exceedance of the PM10 limit values for 24 hours and/or the annual mean average value of NO2 in terms of the year 2009 (cf. Table 2).
As of 2015, an EU-wide limit value of an annual mean of 2.5 µm (PM2.5) is provided for very fine particulate matter smaller than 25 µg/cu.m. Those sections in which limit value exceedances were calculated were therefore classified as “very high pollution levels”, and will furthermore require special attention in future with regard to minimizing near-surface air pollution. These sections are distributed throughout the city; however, they are concentrated in a ring around the inner city, on the major radial roads leading to the south and the east, and on the important connecting roads within Berlin, such as the Bismarckstraße/ Kaiserdamm corridor in Charlottenburg, Tempelhofer Damm, Frankfurter Allee, or Torstraße in Mitte. The total length of these road sections adds up to approx. 47 km of roadway, or 3.4 % of the primary road network; more than 39,000 people live along these streets (cf. Table 5). Thus, both the total length and the number of affected people has been markedly reduced by comparison with the 2005 evaluation (cf. 2008 Edition, Table 4).

Most persons affected live in the area of the so-called “Big Dog’s Head” (see above), and along the radial roads. The urban motorway, which stands out for very high emissions values on the map in fact affects only a few residents, since the distance to residential areas is relatively great, and the air is well mixed, due to the open situation of the motorway.

Moreover, the map indicates that on some 10% of the total length of all sections, the index value of 1.51 to 1.80 is exceeded. This 150 km long part of the primary road network may constitute a problem in future, at least in some areas, since at least one parameter generally shows a exceedance of the respective limit value here.

Table 5: Section lengths of the air pollution index and affected residents in the primary road network of Berlin, 2009

Table 5: Section lengths of the air pollution index and affected residents in the primary road network of Berlin, 2009

The approach used to calculate the number of residents affected by limit value exceedances was also taken from the noise mapping procedure (see Maps 07.05 Strategic Noise Maps, 2008 Edition). The number of residents in the flats facing the street front was counted. The number of citizens affected by limit value exceedances thus ascertained represents a rather conservative estimate, because the pollutants spread everywhere, so that increased concentrations can also occur outside highly polluted canyon streets.

Calculated trends for 2015 and 2020, for the substances PM10 and nitrogen dioxide (NO2)

With regard to permanent compliance with air quality limit values, the calculation of trend scenarios is of great importance. It permits the future development of large-scale and local air pollution to be assessed, and also enables an evaluation of whether additional measures beyond those already initiated are necessary to achieve a reduction in air pollution. The immission values for 2009, which are also the basis for the calculation of the air pollution indices, constitute the point of departure. The resulting trend scenario takes into account the reduction on emissions at the trend points in time 2015 and 2020, for Europe and Germany, and also at the local level in Berlin. Thus, progress due to the implementation of European regulations for pollutant emissions by plants, power stations and motor vehicles is incorporated, as are agricultural emissions of particulate matter.

The exhaust emissions from motor vehicle traffic is likely to decrease, due to the gradual removal of older vehicles with high pollutant emissions; even by 2015, this will amount to almost 40 % for nitrogen oxides and more than 50 % for particulates. However, the particulate matter produced by the abrasion of the road, tyres and brakes, as well as by the resuspension of street dust, will increase insignificantly, due to increased driving activity.

In sum, the result for Berlin will be a drop in NOx emissions by 23 % over 2005 levels by 2015, and by almost 54 % by 2020; and in PM10 emissions by about 9 % and 23 %, respectively.

However, in order to comply with the 24 hour limit for particulate matter everywhere, a significantly greater decrease in concentrations is required, but no such improvement is to be expected without additional mitigation measures, either for the local nor for the imported share of particulate matter air pollution. Hence, exceedance of the 24-hour value for PM10 is still to be expected for 2015 (see Table 6). By 2020 however, no further exceedance of PM10 and NO2 values are in not expected, at least with respect to the limits for the annual mean.

The results in terms of air pollution for 2020 thus promise a much better situation than that which existed in 2009. Compliance with the currently or presumably applicable annual limit values seems possible. However, even in 2020, more than 35 exceedances of the daily limit of 50 mg/cu.m are predicted at many major roads Nonetheless, compared with 2009, the length of the sections of main roads with exceedances and the number of affected local residents is expected to drop by approx. 32 % by 2015, and by approx. 79 % by 2020. Additional measures to reduce particulate air pollution are also necessary

Table 6: Section lengths and residents affected by limit value exceedance in the primary road network, Calculation for 2009 and trend calculations for 2015 and 2020

Table 6: Section lengths and residents affected by limit value exceedance in the primary road network, Calculation for 2009 and trend calculations for 2015 and 2020

In sum it can be stated that:

  • on the measures side in Berlin, the emission of pollutants of industrial plants has been reduced considerably under the limit values stipulated since 2007
  • the measures already realized or initiated will mean that by 2015, the particulate pollution levels in municipal residential areas will drop by 7-10 %, and the nitrogen dioxide levels by approx. 23 %, compared with 2009
  • this reduction will suffice to enable the limit values for particulates and NO2 defined as annual means to be complied with, even in years with unfavourable weather conditions, and for a reduction of the total length of road sections with exceedances of the 24 hr. limit value for particulates by approx. 90 % to be achieved, by 2015.