The map was updated on the statistical base of the edition 1995 (see text there)
The update of the edition 2005 (data base 2001-12-31) was implemented by an external contractor. Changes of land use between 2000 and 2001 were maped and adaptations of geometries and actual block numbers from the Digital basic map Berlin 1:5,000 of ISU were made.
For the changes the informations were taken from the geodata base Flächen mit gesamtstätisch bedeutenden Veränderungspotenzialen (areas with statistically important potential of change) published by the groups: City Knowledge, Urban Development Monitoring and Population Prognosis of the Senate Department for Urban Development. Based on the FNP decision from the House of Representatives in 1994 to regularly monitor conditions, the actually landuse is documented. Areas with a minimum potential for 100 residential units; 10,000 m2 BGF for services; 5,000 m2 retail-sales; 1 ha for trade and industry; 3 ha green-spaces or forest/woodland. Information is available on previous use, planned use, and actual use on completion. Projects started before the study and projects not due for completion before 2002 are also examined.
For the determination of the changes in landuse were also used the following digital maps:
- Digital basic map Berlin 1:5,000 of ISU; status: 2002-8. with new block segments and actual block numbers
- Basic map Berlin 1:5,000; K5, 147 single sheets (1968 until 1999) from the geo data service in the raster format TIFF, published by the land surveying offices, status: 2000-01
- ALK-Berlin, selected data from the ALK with selcted object informations and assignment of allotment areas to ownerships and use categories of the Automatisiertes Liegenschaftsbuch ALB (automated real estate book) for the innercircle S-Bahn, vector formatted; updated by the land surveying offices, status: 1998
- Map “Flächen mit gesamtstädtischen Veränderungspotentialen” (areas with statistically important potential of change), SenStadt IA1. digital map 1:25,000, status: 2002-06-20
- Digital aerial view from LUA Brandenburg in the sheet line system of the K10 Berlin, SW, 1:10,000, status 1998 and
- Digital CIR-aerial photographies of 2000, SenStadt (archive for aerial views) for areas where blocknumbers or restrictions had changed and for surfaces with general urban potential of change (s.a., all up nearly 650 aerial views).
Further the structures of use from all existing Bereichsentwicklungsplanung Berlin (BEP) were analysed. With this statistical base for almost 1427 areas the type of structure (2000-12-31) was appointed.
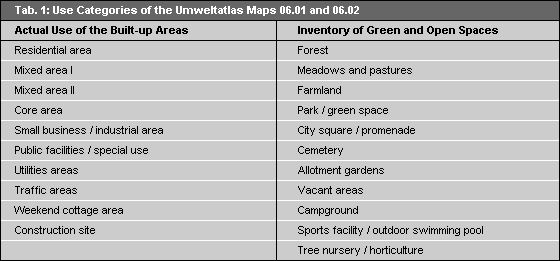
The Umweltatlas Maps (Environmental Atlas) 06.01 “Actual Use of Built-up Areas,” and 06.02 “Inventory of Green and Open Spaces”, were compiled simultaneously with the present map and record the actual land use of Berlin on the basis of 21 different classes (cf. Tab. 1).