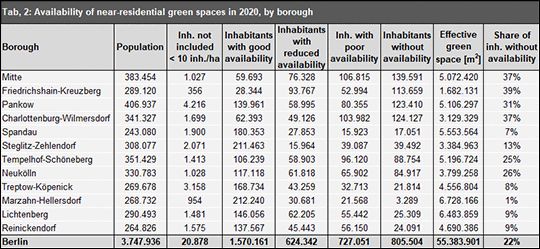
The table shows the populations of the boroughs of Berlin as used for the calculation process; their total populations; the number of residents not considered, i.e., in the blocks with population numbers below the threshold of 10 inh./ha. The remaining columns distinguish between the four degrees of availability ranging from “with good availability” to “without availability” and the inhabitants that fall into these categories (cf. Calculation of the Degree of Availability). “Inhabitants without availability” refers to those people, who, according to the availability analysis, do not have access to suitable and public green space close to their homes.
Inner City Areas
The map shows the detailed situation of availability of green space, by block. As is to be expected, an especially poor situation exists with respect of the availability of green space in the inner city areas with block development from the Wilhelminian period.
Generally, closed block development prevails in these inner city neighbourhoods. Core areas characterized by a low level of private and/or semi-public open spaces also have high structural density. In these areas, serious open-space deficits exist, both in the private and in the public sector.
In the inner city, small green spaces isolated from one another prevail. They are often designed as city squares, and can thus come nowhere near to covering the need for near-residential green space caused by high population density.
Outlying Boroughs
In the outlying boroughs, the situation is generally better. The available green spaces are frequently large; in some cases, forest areas are directly adjacent to residential areas. Due to the less dense development structure, the population density is considerably lower.
As a rule, the level of private green space is relatively high in the outlying boroughs, because of the prevailing single-family and/or row house development, so that deficits in public open space are partially compensated.
The situation is different for the major residential estates at the outskirts of the city, which are characterized by tower high-rises or chains of high-rises. While in Marzahn and Hellersdorf, the open areas of the Wuhle valley and the Hönow chain of ponds largely provide availability of green space, considerable deficits exist in the Märkisches Viertel and Gropiusstadt areas. The shortage of public green spaces there means that an undersupply exits, despite large residential courtyards and connections to the Lübars Recreational Park and the Rudow Grove, respectively.
Availability development between 2011 and 2020
Berlin’s population is growing; since 2010 this has led to a significant increase in its number of inhabitants by around 380,000. On December 31, 2020, Berlin had some 3,769,000 inhabitants. Berlin’s population, however, has not been growing evenly across the individual boroughs. Increases rather vary between more than 50,000 additional inhabitants in Mitte or Pankow as compared to about 17,000 in Steglitz-Zehlendorf (Statistical Office of Berlin-Brandenburg 2020).
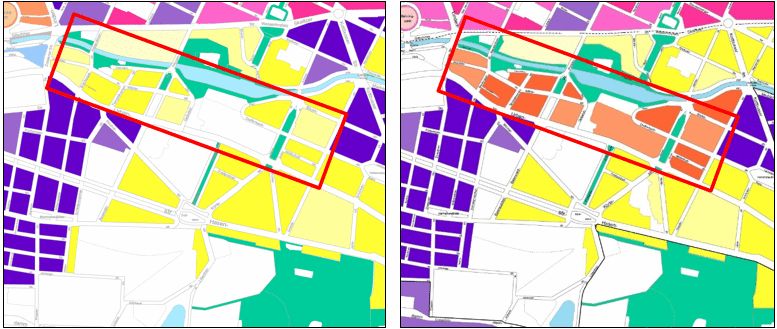
If these new inhabitants are not provided with access to newly built parks as part of compensatory measures, the availability of near-residential public green spaces in the boroughs decreases to a some extent. Densification measures within blocks also reduce the share of private and semi-public open spaces in residential areas.
To avoid misinterpreting the data, one needs to be careful, however, when comparing the availability analyses across different periods of time and when drawing conclusions regarding the improvement or deterioration of the availability. This is necessary primarily because there are differences in the datasets the analyses draw on. For example, the digitised green space data fluctuates somewhat in regards to space and time, without any “actual” change having occurred, i.e. without a perceptible actual loss or gain of green space. Reasons for this include a change in the recording principles (digitisation regulations for a professionally and technically correct structure) of the GRIS data, as well as a change in the green space maintenance structures in the boroughs managed via GRIS. Intake areas, just like green spaces, may need to be adjusted over the years, following, for example, alterations in the urban space or adjustments of the underlying structure. It is therefore important
that the datasets generated initially provide information for the relevant point in time and that an additional investigation into potential causes of change are required for a comparison between datasets.
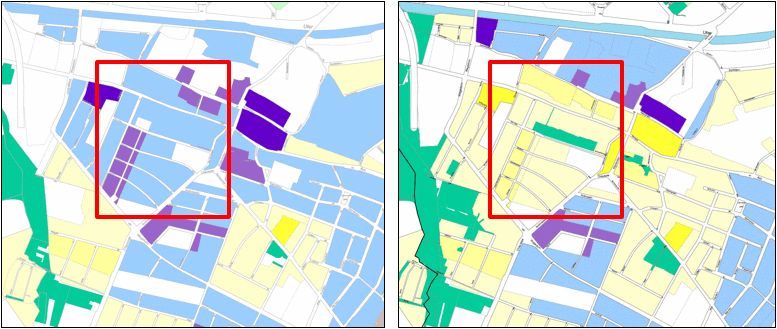
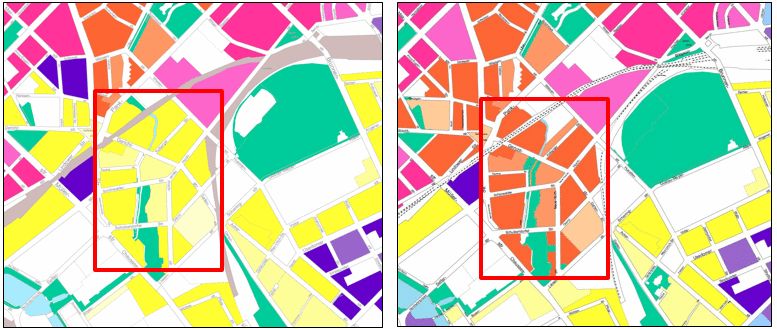
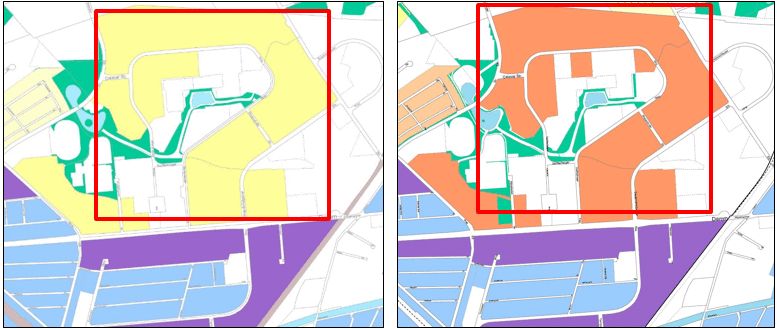
In the following, a few examples of changes are provided in which “technical causes” could be ruled out for an improvement or deterioration in the availability. They demonstrate how a new park or an increase in population may improve or deteriorate the availability of green space.