The Berlin groundwater monitoring network grew rapidly. By 1937, there were already more than 2000 observation wells. After an optimization of the monitoring network in the city area, the State Geology workgroup operates approx. 1,000 observation wells that are installed in five different aquifers.
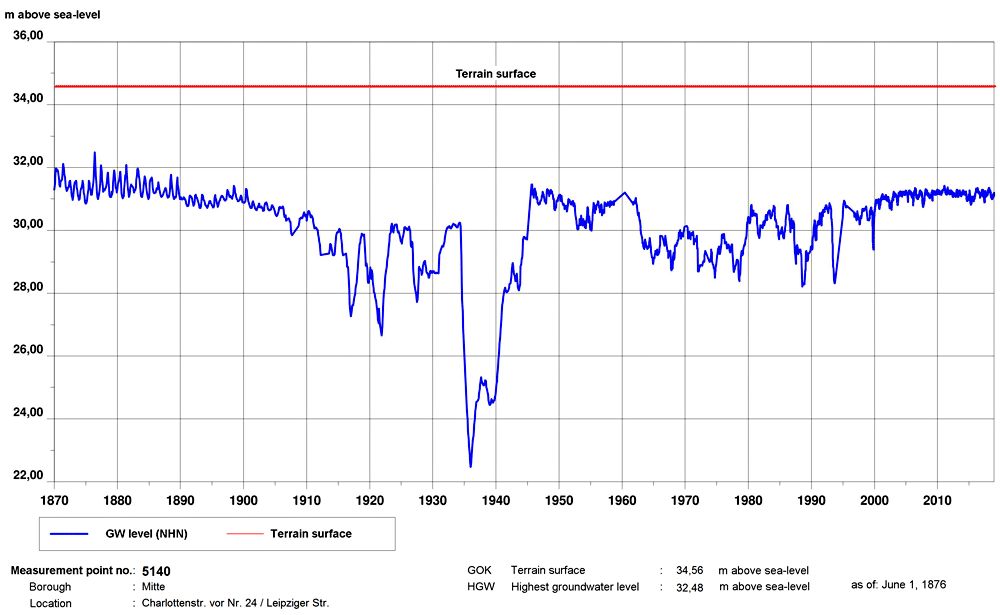
In the inner-city area too, which is not within the area affected by the waterworks, groundwater conditions have been influenced strongly by anthropogenic processes for over 100 years now. This can be shown by way of the example of the hydrographic curve of groundwater level at the observation well 5140 (Fig. 9) in the borough of Mitte, as following:
Until 1890, the largely natural seasonal fluctuations of the groundwater level remained apparent. With the growth of the city, increased impervious coverage, and the construction of small wells for drinking water, the amplitude was reduced, and the groundwater level had, by 1905, been moderately lowered. Thereafter, the large water retention operations connected with major construction sites, e.g. for the underground/ subway and the urban rail lines (S-Bahn), for the construction of the Reichsbank (today, the Foreign Ministry) and for bunkers, etc., with their deep cellars reduced the level of the groundwater by another 10 m over a large area. In 1945, at the time of the collapse of the infrastructure after the Second World War, the groundwater level quickly rose back almost to its original level. During the years of reconstruction, it was then repeatedly lowered again. Since the termination of major construction projects with groundwater retention, the groundwater is now back to
a high level, and major precipitation events rapidly lead to a short-term rise in the level. Here, as in other areas of the city, in buildings which have not been sealed against the maximum expected groundwater levels this causes damage from penetrating groundwater.
In around 1,000 groundwater observation wells, data loggers are installed since the late 1980s, which record the groundwater level on a daily basis. About 10 % of these data loggers are equipped with a remote data transmission module so that the data is sent to the Geological Survey of Berlin on a daily basis. The data from the rest of the data loggers is retrieved manually from the logger on a monthly to three-monthly basis and then imported into the database. The measured values of the city state wide groundwater measuring network are published on the website of the “Wasserportal” and are freely accessible to everyone [available in German only].
In addition, the Berliner Wasserbetriebe and the Brandenburg State Environmental Agency as well as other waterworks operators in Brandenburg provide groundwater level measurement data for the Berlin area and the surrounding areas with an at least monthly measurement frequency. If the groundwater has a direct connection to surface water (effluent situation, Fig. 4a), additional level data from surface-water measurement points are used.
For the present map, the water level data of 1866 groundwater observation wells within Berlin, of 337 groundwater observation wells from Brandenburg and of 47 surface-water measurement points is used for the main aquifer (Aquifer 2). For the groundwater level map of the Panke Valley aquifer (Aquifer 1) on the Barnim plateau, the water level data of 80 groundwater observation wells and 13 surface-water measurement points is used. In groundwater observation wells with daily measurements, the value of May 15th, 2018 was used, while for the other cases, the value was taken from the day that was closest to May 15th, 2018.
The distribution of the groundwater observation wells is irregular: The monitoring network is densest in the city centre and in the immediate intake areas of the water-works, and less dense at the outskirts of the city, especially in the surrounding areas in Brandenburg.