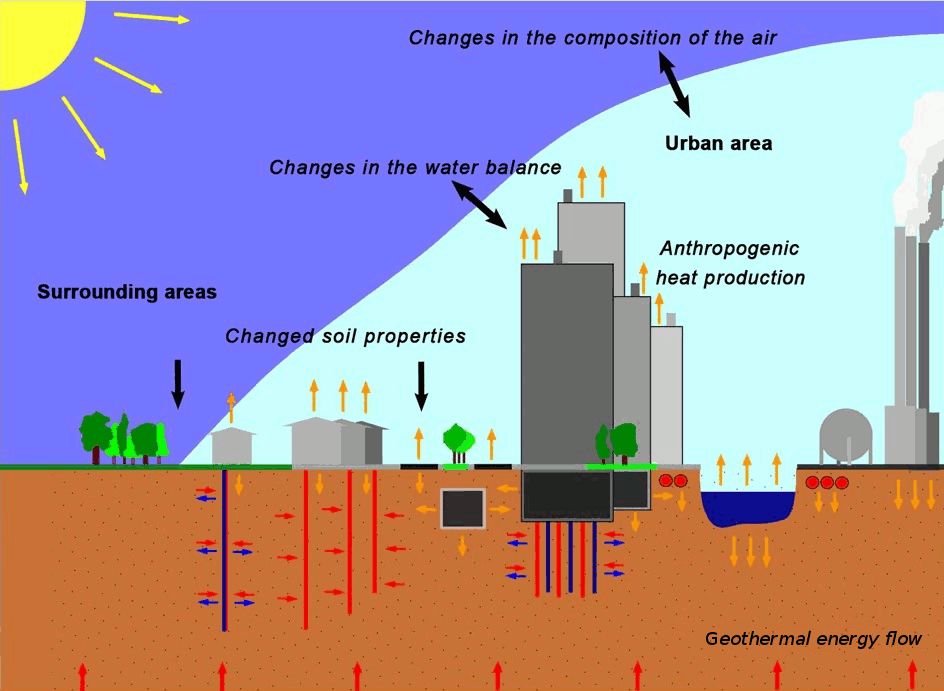
There are many causes for this rise in temperature, which are directly related to the progressing building development, how humans utilise the surface of the earth and the effects of climate change. It may be distinguished between direct and indirect influences on groundwater temperatures (cf. Figure 1):
-
Direct influences on groundwater temperatures include all heat inputs into the groundwater through the sewage network, district heating pipelines, power lines and underground structures, such as tunnels and underground railway systems, underground car parks, etc. They also include heat inputs associated with the thermal use and storage of groundwater heat.
-
Indirect influences on groundwater temperatures include processes that are part of urbanisation and are associated with changes in the heat balance of the atmosphere near the ground. According to GROSS (1991), important variables are:
- The disturbance of the water balance due to a high degree of impervious soil coverage
- The change in thermal surface characteristics, such as surface thermal conductivity and heat capacity due to impervious surfaces and a high density of building structures
- Changes in the energy budget due to changes in the atmospheric composition
- Anthropogenic heat generation (domestic heating, industry and transport).
Compared with the areas surrounding the city, these influencing variables cause changes in the heat balance.
The heat in the city increases gradually; it stores more heat in general, slowly releasing it back into its surroundings. The city may therefore be regarded as a massive heat storage unit. In the long run, this process leads to an increase in the annual mean air temperatures (cf. Map of long-term mean air temperatures 1981-2010,
Map 04.02).
This long-term warming also affects the near-surface groundwater. The physical properties and the chemical and biological nature of the groundwater are temperature-dependent. Increasing temperatures may lead to a deterioration in groundwater quality and an impairment of groundwater fauna
Berlin’s drinking water is supplied by groundwater, which is extracted almost exclusively from the State of Berlin. The groundwater also supplies a large share of the water for industrial use. Therefore, it is of utmost importance to protect the groundwater from fundamental change, such as substantial increases or decreases in groundwater temperature – especially against the backdrop of sustainable water management.
Since 1978, temperature depth profiles have increasingly been recorded at deep groundwater measurement points and temperature measurement points distributed throughout the State of Berlin, in order to ascertain and observe changes.
The purpose of the present map is:
- To update the existing documentation on how the groundwater temperature changes over time beneath the municipal area,
- To serve as a basis for authorising measures which may cause changes in the groundwater temperature, and
- To provide input data for planning and designing facilities for the use of geothermal energy.
In combination with other relevant maps, such as the Geological Outline Map (Map 01.17), the Groundwater Levels Map (Map 02.12), or the Geothermal Potential Map (Map 02.18), the present map may also be used during decision-making and preliminary planning processes for the energy management of groundwater. Underground temperature as a parameter plays an important role in the design of ground heat exchangers.
Groundwater Temperature and the Annual Temperature Curve
The main heat source for the near-surface subsoil, down to a depth of approx. 20 m, is the solar irradiance that hits the earth’s surface. It has a great impact on the surface temperature.
The near-surface soil is heated by irradiated solar energy, which releases the heat into the atmosphere and the subsoil. The annual total of the proportion of solar irradiance that falls onto a horizontal surface, the global irradiance, amounts to approx. 1,000 kWh per sq. m and year in the State of Berlin. There are many parameters that influence the local thermal climate, where the surface of the earth meets the air. Colour, composition, surface roughness, degree of impervious soil coverage, the water balance and the angle at which the solar irradiation falls upon urban surfaces determine how much energy is absorbed and “stored” in building structures, and how much of it is released into the atmosphere or the subsoil.
Generally, temperatures at the surface of the earth, and therefore also the heat input or output, are subject to the periodic fluctuations of a cycle of a year, as the seasons progress.
The surface temperature penetrates the subsoil with decreasing intensity. The penetration depth and speed at which the heat is transported depend on the thermal conductivity of the subsoil among other things.
Heat transfer in the subsoil may be either conductive or convective.
While convective heat transfer involves conducting heat through matter, such as groundwater or seepage water, conductive heat transfer involves transporting energy through the rock without the movement of matter.
Solar irradiance is the main source of heat near the surface. The geothermal energy flow, directed from the earth’s interior to the surface, originates from the decay of radioactive isotopes in the subsoil. In contrast to solar irradiance, it is only of secondary importance.
Heat flux density, which is defined as the rate of heat flow per unit of area perpendicular to the standard area, varies regionally in the continental crust of the earth. According to Hurtig & Oelsner (1979), and Honarmand & Völker (1999), the mean heat flux density ranges from approx. 80 to 90 mW/sq. m in the State of Berlin. The annual energy total thus ranges between 0.7 and 0.8 kWh per sq. m and year, which is approx. 1/1,000 below that of the global irradiance.
The near-surface groundwater temperature is essentially determined by the energy exchange between the sun, the earth’s surface and the atmosphere, and to a much lesser degree by the heat flow moving from the earth’s interior towards the surface.
Berlin’s long-term mean air temperatures recorded between 1981 and 2010 range between 9.3°C and 10.4°C, depending on the exact location (SenStadtWohn (2021)).
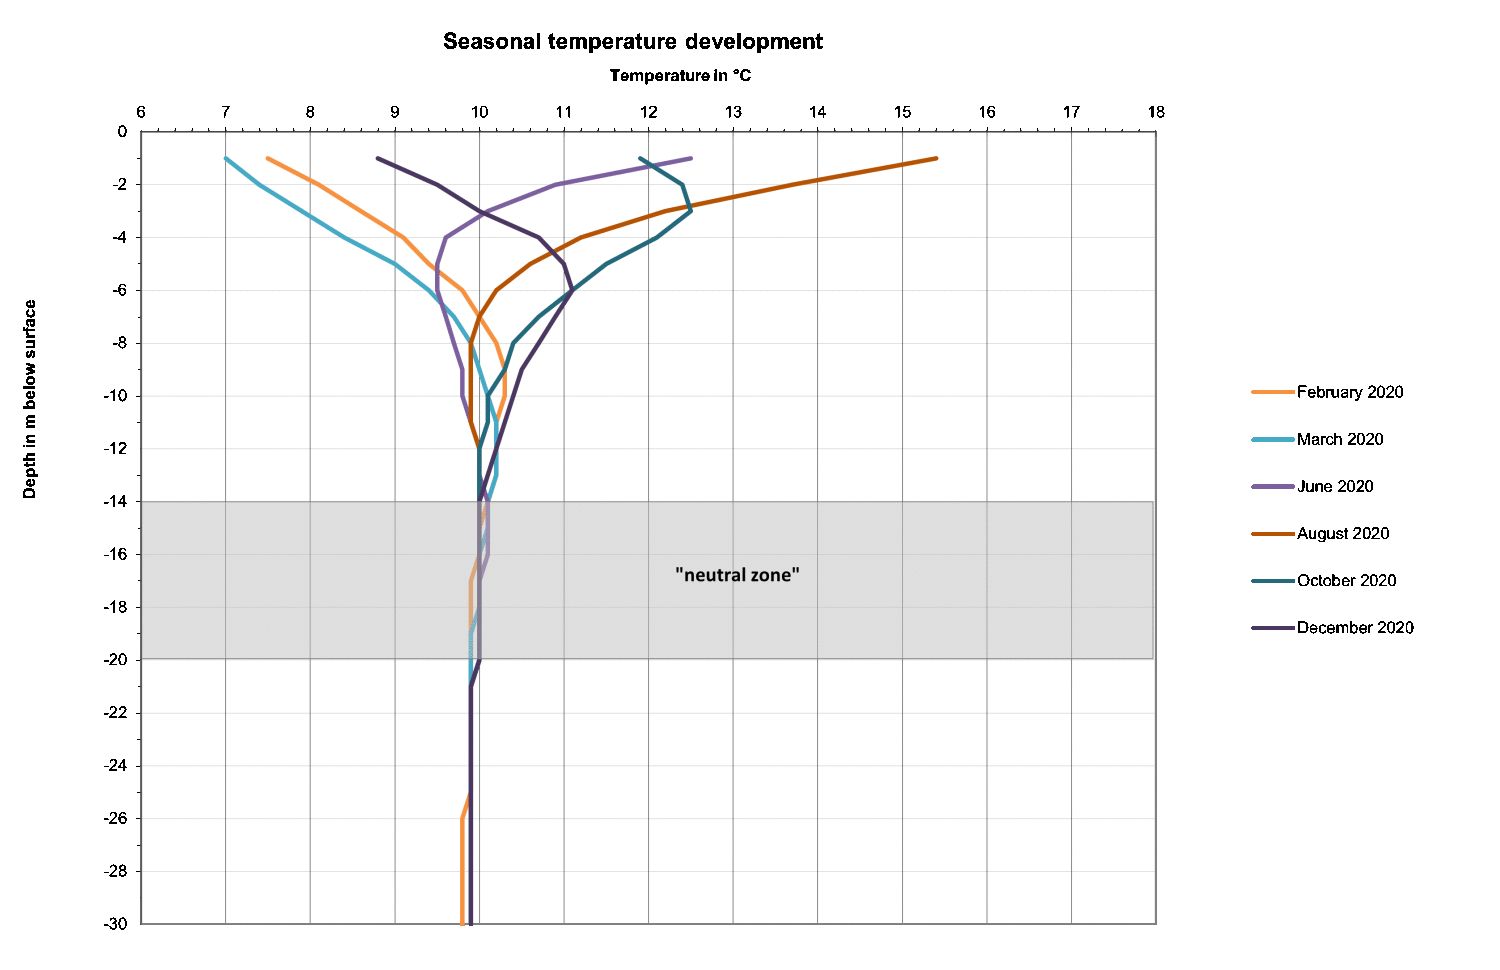
While daily fluctuations affect the soil only to a depth of approx. 1 m, seasonal fluctuations reach depths of between 15 and of 20 m. Below this depth, where seasonal effects can no longer be detected, i.e. in the “neutral zone”, temperatures rise depending on the thermal conductivity of the rock and the regional heat flux density (Fig. 2).
Down to a depth of approx. 300 m, the average rise in temperature ranges between 2.5°C and 3°C per 100 m in the Berlin area.