Near Ground Wind Speeds 1991

Introduction

Wind Conditions in Conurbations

Near ground air exchange processes have an essential significance for the air hygiene conditions and the climate of a region. The wind speed is used as a measure of air exchange. It describes the speed of the wind stream; at the same time showing that the atmosphere pulls or pushes away air masses. Within built-up areas, as opposed to the open countryside, an average of 20 – 30 % decrease in the wind speed at near ground can be expected. A simultaneous increase in the level of bio-climatic and air hygienic pollution frequently prevents the introduction of unpolluted air masses on the one hand as well as the turbulence, thinning and the evacuation of this polluted air on the other hand. In the immediate vicinity of individual building structures and in the street area, it can come however to very heavy increases in the wind speed caused by squalls and wind channelization with its accompanying unpleasant effects to persons (wind load, dust squalls, eye irritation etc.).

The wind is defined in terms of a vector of its direction and speed. The continuous wind measurements are taken, as per international agreement (World Meteorological Organization 1983), at fixed, least disturbed stations at a height of 10 m above the ground.

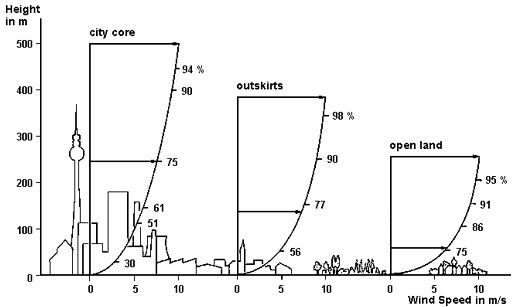
The decisive determinant of the vertical profile of the wind speed is the respective terrain roughness (cf. Fig. 1).

Decrease in Wind Speed as Influenced by Varieties of Terrain Roughness

Fig. 1: Decrease in Wind Speed as Influenced by Varieties of Terrain Roughness

Further influence can be exerted either by relief-conditioned cold air drainage especially during low exchange nocturnal radiation periods with slight degree of cloudiness or in urban areas by particular wind systems created through plain wind effects.

The air masses ascending as a result of the strong warming of the city cause after-streams of cooler air from the surrounding countryside. Plain wind effects can only work in the inner city if from the center of town outgoing air channels are available or at least permeable building structures leading to the urban periphery. For very big conurbations like Berlin the plain wind effect plays a role in the above all near cold air generating areas on the city periphery, but also in green spaces in the inner city. The proof for such plain winds requires enormous effort and therefore has up to now only been simulated in a model for Berlin (cf. Wagner 1993 and Map 04.07, SenStadtUm 1993).

Wind Direction and Wind Speed

In Berlin different long-term measurement series for the horizontal wind conditions can be found for different wind measurement stations. The meteorological station at the airfield Tempelhof gives, in comparison to all other stations, the least disturbed and for regional standards the most representative wind speed measurements (cf. SenStadtUm 1994).

In the regional standard, the wind conditions in Berlin are determined through the situation in the transition between continental and more oceanic climate. Certainly the west – to northwest winds correspond to the oceanic component with mainly less polluted sea air. The east – to southeast winds correspond to the continental component with lower wind speeds and above all the higher pollutant concentration in the winter (cf. Fig. 2 and 3). Within the city boundaries however, small scale elements, like temperature – and pressure differences between different city structures also influence the wind currents.

Relative Frequency of Hourly Averages for Wind Direction and Speed at the Station Tempelhof Airport 1975-1990, Measurement Height 10 m

Fig. 2: Relative Frequency of Hourly Averages for Wind Direction and Speed at the Station Tempelhof Airport 1975-1990, Measurement Height 10 m

The distribution of the wind directions for the Berlin region is representative for both day – as well as night hours (cf. Fig. 2). The most frequent wind direction is west with 21 % of all hours, followed by southwest with 16 %. At both wind directions wind speeds > 4 m/ s appear with the most frequency. North and north east are represented as wind directions of least frequency.

The mean wind speed (averaged over the year) is greatest (cf. Fig. 3) at the most frequent wind directions (west and southwest). Winds from the southeast display, on average, the lowest wind speeds. The annual course of the wind speed has its maximum in the winter and its minimum in the summer months.

Mean Wind Speeds in the Course of the Year and in Relation to the Wind Direction at the Station Tempelhof Airport 1975 - 1990, Measurement Height 10 m

Fig. 3: Mean Wind Speeds in the Course of the Year and in Relation to the Wind Direction at the Station Tempelhof Airport 1975 - 1990, Measurement Height 10 m

Emission-climatologically unfavorable weather conditions with wind speeds < 2 m/ s and/or lulls have been registered at 18 %. As mentioned, in the winter the frequency distribution shifts in favor of higher wind speeds.

From this standpoint, the open monitoring site Tempelhof airport is neither altogether nor during the winter months to be ranked as an emission-climatologically unfavorable location.

Wind directional distribution

A comparison of long-term measurement series from four stations in Berlin (Ostkreuz, Buch), Potsdam and Schönefeld for the wind directional distribution shows for all measurement sites a similar predominance of west – to southwest winds (cf. Fig. 4). Wind roses are presented for the long-term Berlin reference station Dahlem additionally for the half-year periods summer (May-October) and winter (November-April) (cf. Fig. 5).

Relative Incidence of the Wind Direction at the Stations Berlin - Buch, Berlin - Ostkreuz, Schönefeld and Potsdam 1962 - 1976

Fig. 4: Relative Incidence of the Wind Direction at the Stations Berlin - Buch, Berlin - Ostkreuz, Schönefeld and Potsdam 1962 - 1976

The wind roses in Fig. 5 also show the above-mentioned distributions, nonetheless with great seasonal variations. Thereby it should be noted that especially the distribution of the remaining wind directions at all stations differ greatly. The cause for these deviations lies in the respectively specific environment the measuring stations. Similar heterogeneity in the measuring results can also be seen in the maps of near ground wind direction (Maps 04.03.3 and 04.03.4, SenStadtUm 1985). Here the wind directions are presented only for the respective measuring site. Unlike with the wind speeds the statements cannot be applied directly to comparable city structures.

Relative Frequency of the Wind Directions at the Station Berlin - Dahlem for the Whole Year, Summer (May - October) and Winter (November - April) 1971 - 1990

Fig. 5: Relative Frequency of the Wind Directions at the Station Berlin - Dahlem for the Whole Year, Summer (May- October) and Winter (November - April) 1971 - 1990