Traffic-related Emissions and Immissions 2005

Statistical Base

Motor Vehicle Traffic Emissions Registry

The Motor Vehicle Traffic Emissions Registry was compiled anew on the basis of traffic counts for 2005, because according to experience to date, this category of polluters contributes significantly to particulate and nitrogen oxide pollution. Traffic counters have been installed at many locations on the primary roads of Berlin since 2001. This data serve to make the current traffic patterns in Berlin accessible, and to incorporate them into traffic management. This information is evaluated in the Office of Traffic Management (VMZ), and is used to inform the populace (especially drivers) of traffic conditions and provide routing recommendations to avoid traffic jams via radio broadcasts, the internet, and centrally located sign boards.

Ascertainment of Traffic Volume

Since 2002, the data from approx. 400 detectors at about 300 locations within the Berlin primary road network have been available at the VMZ. Many of these detectors distinguish between cars and lorries, and can be used for approximate annual traffic counts.

In addition for 2005, traffic count figures for cars and lorries from an official count by trained persons at many intersections ordered approximately every 5 years by the Senate Department for Urban Development were available. Compared with counts by detectors, this official traffic count has the advantage of being better able to distinguish between lorries of more than 3.5 t and other motor vehicles. Therefore, this traffic count was selected as the basis for the Emissions Registry for 2005, as the 1999 and 1994 counts had been.

The exhaust emissions were then ascertained as follows:

  • The extrapolation of the point-related intersection counts to the entire Berlin primary road network with a traffic-flow computational model (VISA) by the Senate Department for Urban Development yielded the results showing the mean daily traffic figures (DTV) and the proportions of lorries for all major streets.
  • The ascertainment of the segment-related pollution of the primary road network with regular bus traffic of the Berlin Transit Company (BVG) is calculated from the bus schedule data for 2005.
  • The calculation of the emissions with the emission factors from the UBA manual for emissions factors (Edition 2.1, 2004) with consideration for the type of road and its function, was ascertained with the aid of the programme IMMISem/air.

Ascertainment of Emissions

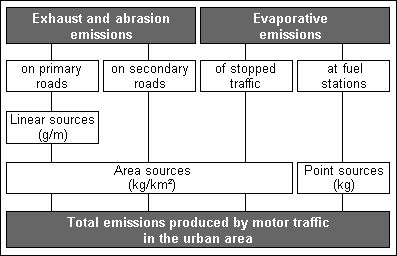
The pollution emissions from motor vehicle traffic include exhaust and abrasion emissions from moving traffic, evaporation emissions from standing traffic, and evaporation emissions from fuel stations. Figure 2 provides an overview of the survey system. Emissions at fuel stations are assigned to “small business”.

Fig. 2: Survey systems for the Traffic Emissions Registry, 2002

Fig. 2: Survey systems for the Traffic Emissions Registry, 2002

The pollution and CO2 emissions of linear sources (primary roads) and area sources (secondary road networks and evaporation emissions) are calculated with the aid of emission models.

The exhaust and abrasion emissions appear as linear sources on primary and secondary roads. However, they are only calculated as linear sources for the primary road network, because the aforementioned DTV traffic counts are only available for those streets. The emissions from the linear sources are then assigned to the grid network as area sources. The emissions from the secondary road network are, however, derived directly from estimates of traffic volume and lorry shares for each grid.

The Emissions Models Primary Roads (Linear Sources) and Secondary Road Networks (Area Sources)

Exhaust emissions from motor vehicle traffic depend on factors which can be summarised as traffic-specific and motor vehicle-specific quanta.

Traffic-specific quanta are described by traffic density, i.e. the number of vehicles moving on a given section of a street (source), and their driving style (driving mode). Driving style is determined according to different street types (city centre street, secondary road, primary road with or without traffic lights, freeway), and function (shopping street, residential street, or access street).

The motor vehicle-specific quanta, generally expressed by exhaust emissions, are determined by:

  • the type of engine (four-stroke, two-stroke or diesel)
  • the type of carburetion (carburettor or fuel injection)
  • the type of fuel (two-stroke mixture, gasoline, diesel)
  • the type of purification system, if any (regulated or unregulated catalytic converter, recycling of exhaust gases); and
  • other factors pertaining to the technical condition of the engine.

Emissions also depend on the driving style (driving mode), and are therefore stated for various driving styles. Cold weather starts, which lead to increased emissions during the warm-up phase of the engine, together with evaporation emissions, are considered important vehicle specific quanta.

The emissions factors are provided in the UBA Emissions Factors Manual (Version 2.1, April 2004) for each year from 1990 through 2020. It lists the emission factors for all relevant emitted substances for each vehicle group (passenger cars, light commercial vehicles, motorised two wheeled vehicles, busses and heavy commercial vehicles), for currently at least five reduction levels (1980s ECE cycle, Euro I, Euro II, Euro III, Euro IV, Euro V – only for heavy commercial vehicles), and for each type of street.

The stricter exhaust standard Euro 5 for cars is stipulated as mandatory for new vehicles as of September 2009. However, the planned stricter standard Euro VI for heavy commercial vehicles and Euro 6 for cars will very likely become effective only as of 2013. These exhaust standards cannot be taken into account with the present version of the UBA manual, so that realistic forecasts of motor vehicle emissions are only possible through 2010, and to a limited degree through 2015.

Ascertainment of Emissions from Abrasion and Air Movement Caused by Street Traffic

With today’s knowledge, it is assumed that a large part of traffic related PM10 emissions do not originate from vehicle exhaust, but rather from the wind stirring up the particulate matter lying on the street surface, and from tyre and brake abrasion.

The calculations of these emissions with IMMISem/air are based on the modified EPA formula from corresponding investigations. This formula was developed from measurements taken on Schildhornstrasse and on Frankfurter Allee, and is based on the finding that approximately 50 % of the measured additional particulate in canyon streets in not attributable to motor vehicle exhaust, but is rather caused by motor vehicle related abrasion (braking and street/tyre abrasion) and air movement. Since exhaust emissions have since been further reduced by improved engine technology, the proportion of additional pollution due to non-exhaust-caused emissions is today considerably higher than 50 %.

Figure 3 shows each output quantum for the calculation of exhaust and abrasion emissions from traffic, such as driving style factors, “stop and go” supplement, cold weather start factors etc., as well as the results.

Fig. 3: Emission model for the calculation of quantities of emitted pollutants on primary roads

Fig. 3: Emission model for the calculation of quantities of emitted pollutants on primary roads

Emissions from motorised two wheeled vehicles cannot be shown due to a lack of traffic counts on the primary road network. Their contribution to the total is determined on the basis of the average traffic load in Germany and available emissions data.

For areas with distinct orography, the street sections should be arranged in longitudinal categories. However, this is not necessary for Berlin.

Emission Model Secondary Roads Networks (Area Sources)

Fig. 4: EM-NEBEN - Emission model for the secondary roads networks (Area Sources)

Fig. 4: EM-NEBEN - Emission model for the secondary roads networks (Area Sources)

The traffic pollution on secondary roads for 2005 was calculated with the aid of the traffic routing programme VISUM, based on the underlying source-goal relationship. The resulting total driving performance and the proportion of heavy commercial vehicles was assigned to traffic cells in the city. The emissions from exhausts, and from dust stirred up by wind and from abrasion in secondary roads, was determined using the IMMISem/air emissions module.

In secondary roads networks, emissions are not calculated for specified sections of streets, but rather as grids per square kilometre. The driving performance for the grids is determined on the basis of:

  • predominate use of the area, either
    • residential areas in the outskirts;
    • commercial and industry; or
    • inner city and sub centres
  • the number of residents and jobs is categorised as
    • trade and service jobs, or
    • manufacturing,
  • the results are in source/goal matrices of motor vehicle traffic.

Further inputs for determining total emissions of each pollution component for each area correspond to those for the calculations in the primary roads network.

Exhaust and Abrasion Emissions in the City

Table 3 breaks down the driving activity caused by motor vehicle traffic in the city of Berlin (millions of vehicle kilometres per year); fuel use (t) and the exhaust and abrasion emissions of vehicular traffic (t/year), by type of vehicle, for the reference year 2005.

Tab. 3: Traffic volume (million vehicle km/year), fuel consumption (t) and exhaust and abrasion emissions (t/year) in the municipal area of Berlin, by type of vehicle; Reference year: 2005

Tab. 3: Traffic volume (million vehicle km/year), fuel consumption (t) and exhaust and abrasion emissions (t/year) in the municipal area of Berlin, by type of vehicle; Reference year: 2005

The new method of measuring emissions for this registry is also a suitable basis for dispersion calculations to determine the extent of pollution at streets. The extensive reorganisation of calculation methods permits only very limited comparisons with previous emissions increases, because these were based on a much simpler method of calculation.

Immission – The Results of Stationary Measurements

Street measurement points are operated to ascertain the pollution caused by motor vehicle traffic, in the framework of the automatic BLUME air measurement street measurement station system. In recent years, some changes have been carried out in the Berlin air quality measurement system, in order to comply with EU Directives and the amendments to the BlmSchG and the 22nd BlmSchV of 2002, resulting from those directives.
Since the concentrations of sulphur dioxide and carbon monoxide have now been reduced to only a fraction of the limit values, the measurement of these substances has been correspondingly reduced. At the same time, more attention is being directed towards the ascertainment of particulate matter (PM10) and nitrogen dioxide, particularly in the proximity of traffic.

Measurement of Immission in the Municipal Area

In 2008, air pollutant measurement was conducted at a total of 15 measurement containers (5 at the outskirts, 5 in the inner-city background and 5 at street locations), and at 37 RUBIS measurement points. These small measurement points with active and passive collectors for gathering weekly mean nitrogen dioxide, benzene and soot values have been providing measurements bi-weekly since 2005. The situation of each measurement point is shown in Figure 5. The exact addresses are listed in the monthly reports on air-pollution control of the Senate Department for Urban Development (only in German).

Fig. 5: Locations of the automatic container measurement stations of the BLUME measurement network, as well as the small RUBIS measurement points, 2005

Fig. 5: Locations of the automatic container measurement stations of the BLUME measurement network, as well as the small RUBIS measurement points, 2005

The level of measured concentrations is not solely dependent on the number of motor vehicles and the resulting emissions, but also on the air exchange conditions, which are on the one hand determined by meteorological parameters (e.g. the wind), and on the other by the type and extent of buildings. Thus, there is a high immission impact registered in streets with buildings on both sides (canyon streets), such as on Silbersteinstr. in Neukölln, or Schildhornstr. in Steglitz, while the city motorway, which carries a noticeably higher traffic volume, lower pollution concentrations are found. Figure 6 shows typical pollution distribution in a canyon street. Such distribution develops if the wind direction (over roof level) leads from the measurement point towards the road, resulting in a turbulence formed in the canyon street. This blows the motor vehicle emissions to the side of the road where the measurement point is located.

Fig. 6: Pollution distribution in a canyon street with the measurement range as per the 23rd BImSchV, and the receptors used for calculation with the IMMISem/air canyon street model

Fig. 6: Pollution distribution in a canyon street with the measurement range as per the 23rd BImSchV, and the receptors used for calculation with the IMMISem/air canyon street model

Long-term trend of nitrogen dioxide concentration in the municipal area

The results of the measurements carried out through 2007 on major streets indicate the following long-term trend (cf. Figure 7):

  • A clear drop in nitrogen dioxide concentrations was achieved around 1995 by equipping the Berlin power stations with denitrification facilities, and the introduction of the regulated catalytic converters for gasoline-powered vehicles.
  • NO2 pollution has hardly changed during the past ten years at any of the three station categories shown. The values of heavily-travelled streets (red curve) are still considerably above the EU annual average limit value of 40 µg/cu.m.
  • The expected reduction in nitrogen oxide emissions due to the improvement in exhaust gas technology in vehicles has not achieved any reduction in nitrogen dioxide pollution.
Fig. 7: Long-term trend of nitrogen dioxide values in Berlin

Fig. 7: Long-term trend of nitrogen dioxide values in Berlin

(more information provided under Long-Term Development of Air Quality [only in German])

Long-term trend of the PM10 concentration in the municipal area

Figure 8 shows the development of PM10 and total particulate concentrations in Berlin and the surrounding areas over the past twenty years (in 1997, the measurement system was changed from total dust to particulates [PM10]).
The red curve shows pollution at three measurement points near traffic, while the blue and dark-green lines show the concentrations at three measurement points in populated areas of the inner city, and at five measurement points on the outskirts of the city, respectively. The measured soot levels at eight traffic measurement points are shown by the black curve. Data from up to four rural stations in Brandenburg was added, for purposes of comparison with the data from urban areas.

Fig. 8: Long-term trend of PM10 and soot concentrations in Berlin

Fig. 8: Long-term trend of PM10 and soot concentrations in Berlin

(more information is provided under Long-Term Development of Air Quality [only in German])

A comparison of the curves reveals the following noteworthy points:

  • The PM10 concentrations in the rural areas of Brandenburg around Berlin in 2003 already came to approximately half the PM10 pollution level on major Berlin inner-city streets, and increased through 2007 to about two thirds of the level of the PM10 pollution on major Berlin streets.
  • The drop in dust values which continued throughout the nineties has not continued during the past few years. By contrast, the soot pollution level on major streets declined continuously from 1998 to 2004, by almost 40 %, one cause being the improvements in exhaust gas technology in the vehicles, including those of the bus fleet of the Berlin Transport Company (BVG) (cf. Fig. 8, Berlin Environmental Atlas Map 03.11, 2005 Edition).
  • The annual variation of PM10 levels is similar at all stations. In particular, the clear resurgence of PM10 levels in 2002 and 2003, and in 2005 and 2006 is a phenomenon that has appeared at the same time throughout the city, as well as at stations located on the outskirts of the city. Therefore, to find the cause, one should not concentrate primarily on Berlin’s PM10 emissions; rather, the cause is attributable to unfavourable weather conditions and large scale transport of particulate matter. The values then rose again in subsequent years, following a slight drop in 2004.