The existence of different data bases made separate calculation of long-term mean temperatures for West Berlin and East Berlin / surrounding countryside necessary. However, the calculation procedures used were largely analogous. The procedure should be briefly outlined, since the entire procedure had to be performed for East Berlin / surrounding countryside.
The assignment of individual measurement points to continuously monitoring climate stations according to the development and other structure of their surroundings, is of central importance for various stages of calculation. It was assumed that the course of temperatures at the climate stations could be depicted at the measurement points.
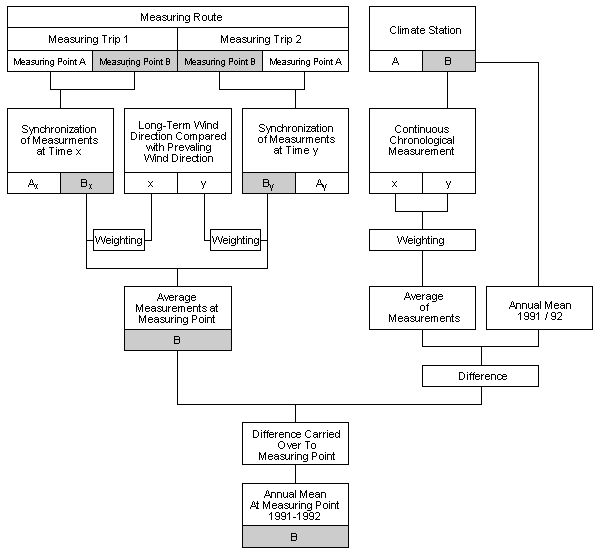
As a first step, this assignment enabled the various measurements of a measurement trip to be synchronized, i.e., referenced to a point in time (von Stülpnagel 1987). The results of the measurement trips for each measurement point were then used to calculate a mean value. The long-term wind statistics for 1950 through 1970 from Berlin-Dahlem (Riemer 1971) were applied for the weighting of individual surveys: The relevant air temperature value was weighted for the determination of the mean value by means of the wind direction at the referenced point in time of each survey, and its share of the long-term mean of all wind directions.
The projection of these results onto the mean annual values for 1991-‘92 again proceeded by means of the measurement points assigned to the climate stations. The climate stations monitored the temperature continuously during 1991-‘92. This enabled the determination of mean values for any given point in time. The projection of the mean value for the measurement point required the mean annual values of the climate station and its corresponding time-referenced mean value for the measurement points. Under the assumtion that the locations of the measurement points would behave like their associated climate stations, the difference between these two values measured at the station was carried over to the associated measurement points. Figure 3 shows this procedure schematically.