Please note that additional, more detailed information, in particular regarding the methodological approach and the differences to the approach used in the noise mapping of 2017, may be found in the published project report of the commissioned engineering firm (Wölfel 2023, only in German).
New
The Environmental Atlas maps are available in the new Map Application
Strategic Noise Maps 2022
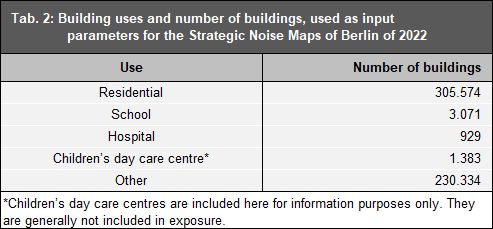
Tab. 2: Building uses and number of buildings used as input parameters for the Strategic Noise Maps of Berlin of 2022
Image: Umweltatlas Berlin
Tab. 3: List of IED plants included in the Strategic Noise Maps of 2022
-
No.
IED Plant
-
1
Lichtenberg Cogeneration Plant, Rhinstraße 70
-
2
Mitte Cogeneration Plant, Köpenicker Straße 59-73
-
3
Scharnhorststraße District Heat Plant, Habersaathstraße
-
4
Reuter West Cogeneration Plant, Großer Spreering 5
-
5
Reuter Cogeneration Plant, Otternbuchstraße 11
-
6
Lichterfelde Cogeneration Plant, Ostpreußendamm 61
-
7
Charlottenburg Cogeneration Plant, Am Spreebord 5
-
8
Klingenberg Cogeneration Plant, Köpenicker Chaussee 42-45
-
9
Wilmersdorf Cogeneration Plant, Forckenbeckstraße 3-6
-
10
Moabit Cogeneration Plant, Friedrich-Krause-Ufer 10-13
-
11
Köpenick Block-Scale Power Plant, Wendenschloßstraße 176-182
-
12
Buch Cogeneration Plant, Schwanebecker Chaussee 17
-
13
Neukölln District Heat Plant, Weigandufer 489
-
14
Märkisches Viertel District Heat Plant, Wallenroder Straße 2
-
15
Lange Enden Peak Heat Plant, Lange Enden 15-25
-
16
Schering AG Firing Plant, Müllerstraße 178
-
17
BTB mbH Berlin, Albert-Einstein-Straße 22
-
18
Neukölln Wood-fired Cogeneration Plant, Köpenicker Straße 26
Environmental Atlas Contact
Berlin Senate Department for Urban Development, Building and Housing
Mrs. Haag