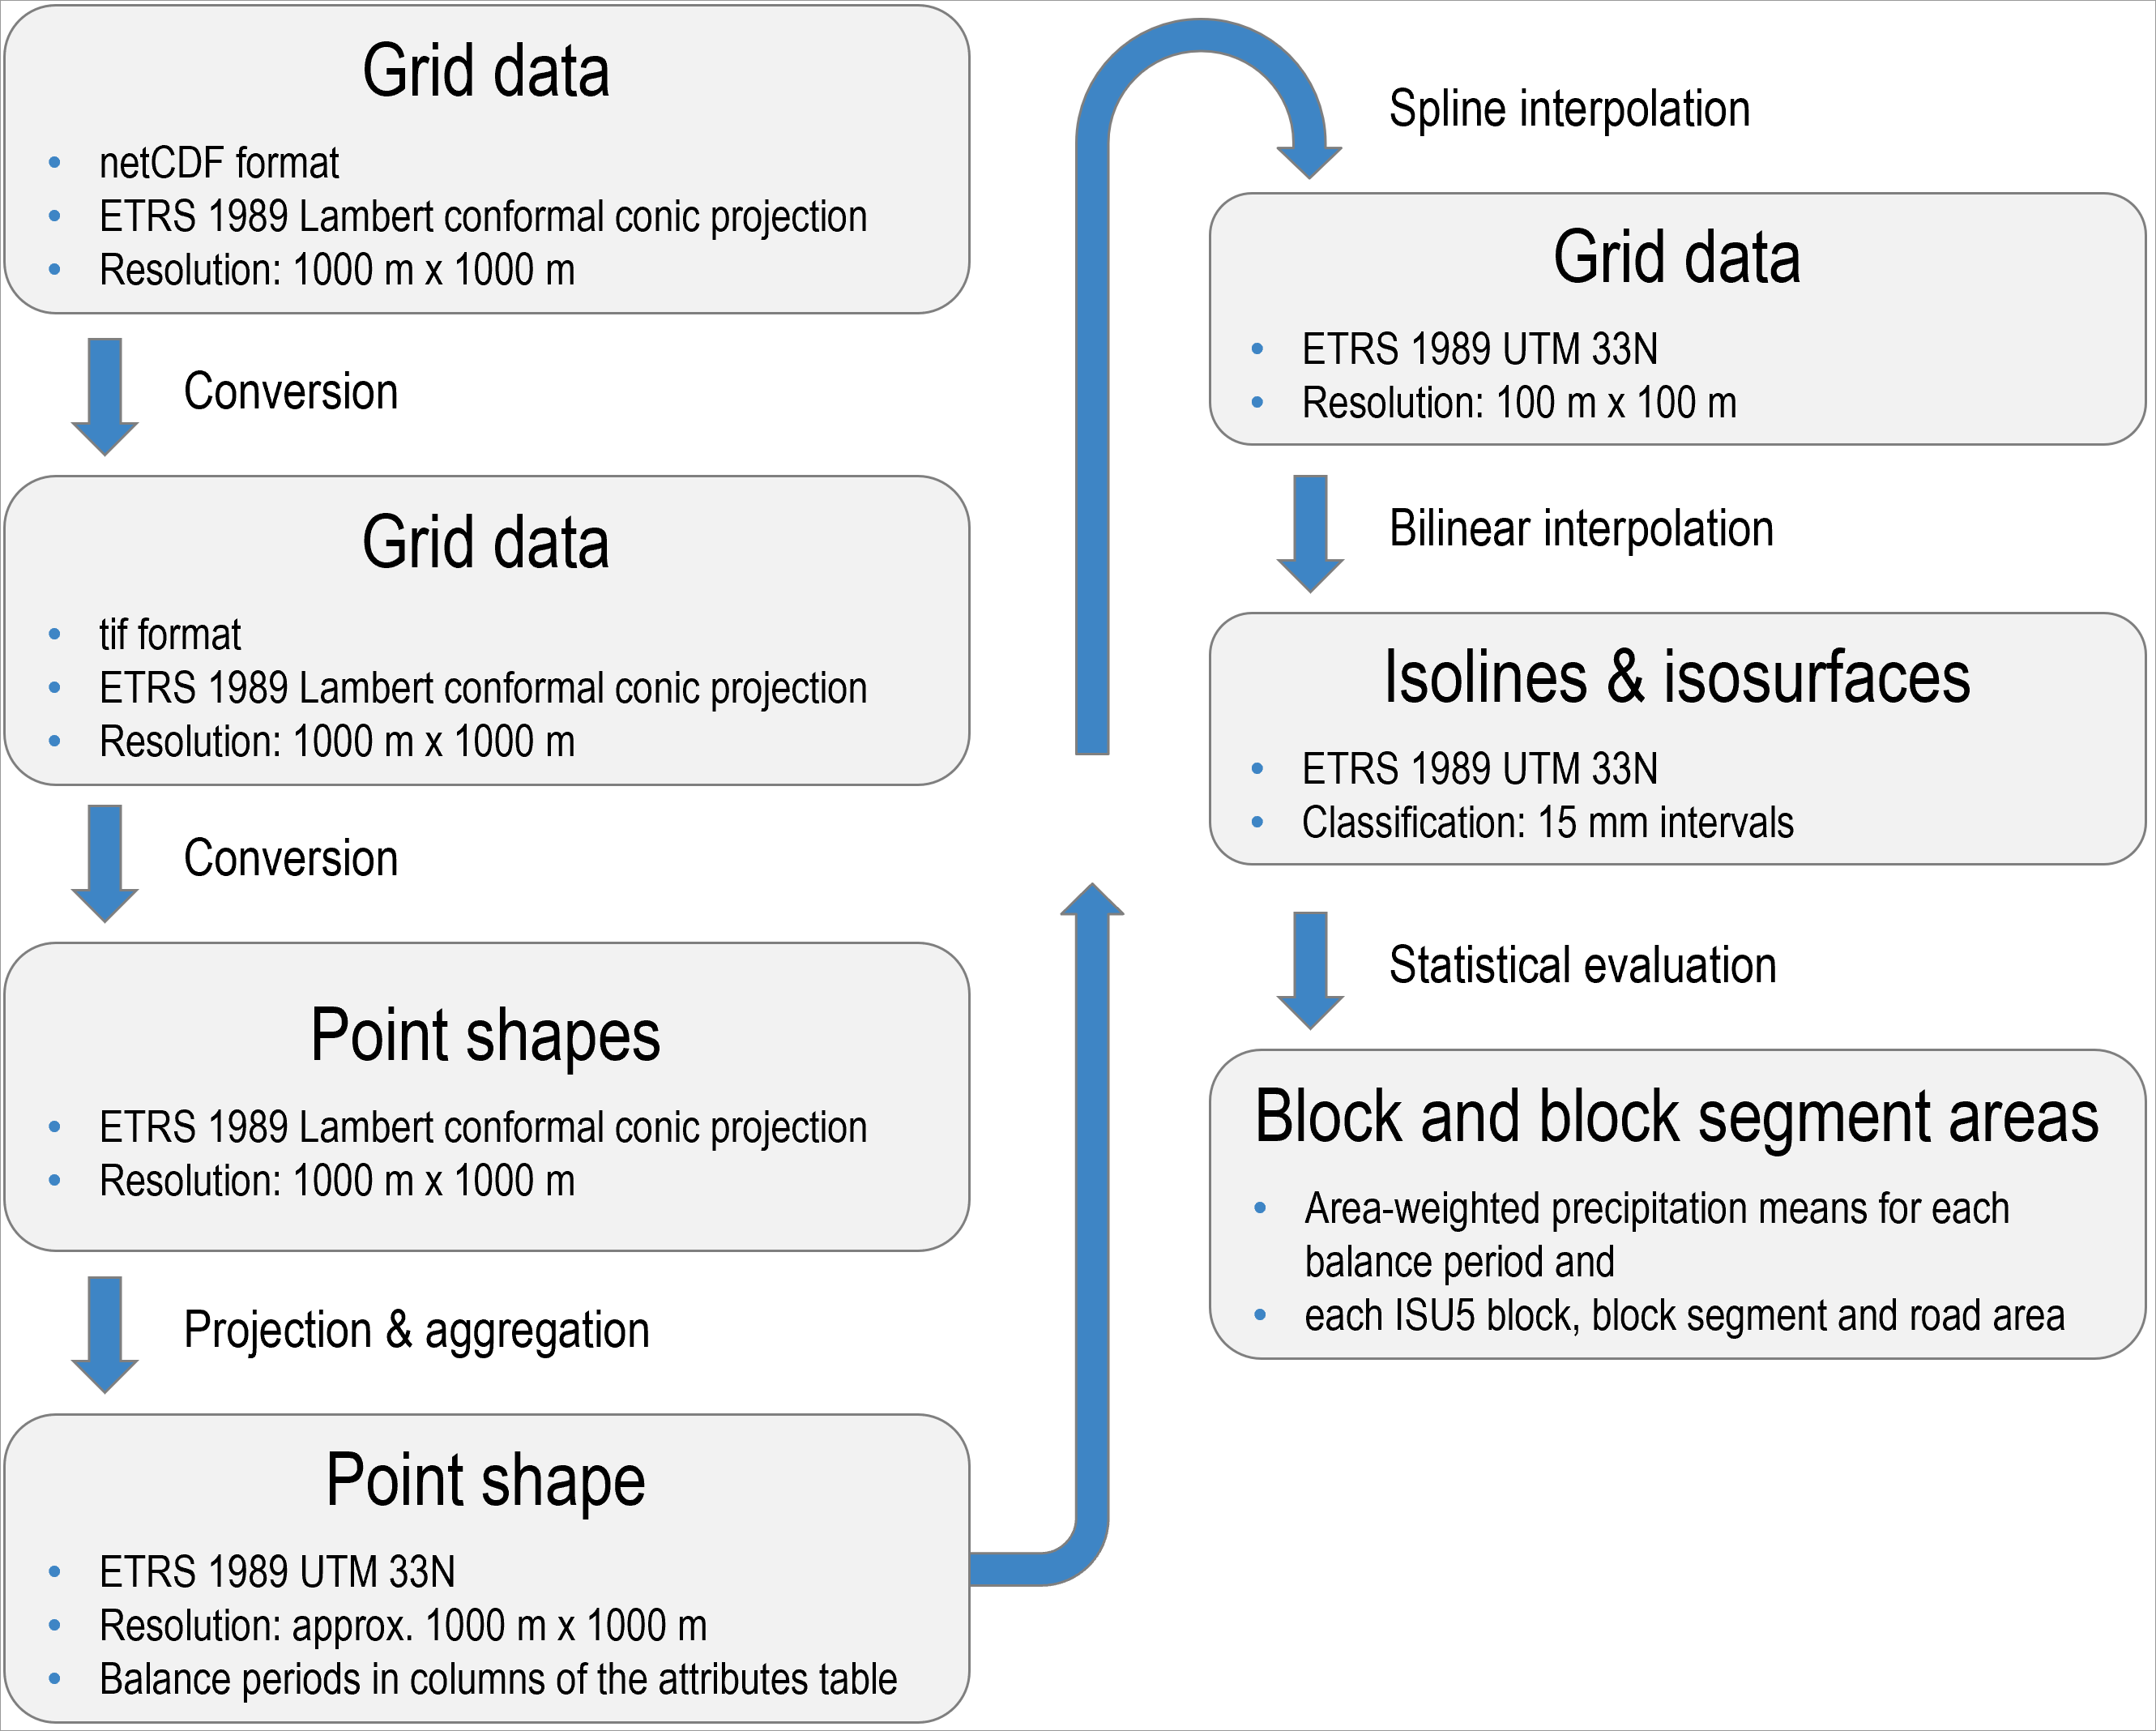
The source data was available in netCDF format (version 4), an open standard binary file format. The data format is self-describing and contains information on the data structure, which is stored in one- or multi-dimensional arrays within a data set. Many programmes support netCDF files. The data was converted into another grid format (tif) here.
The HYRAS-DE-PRE data on long-term precipitation means is available as a two-dimensional data set (x, y, excl. time) for each reference period (one year, six months, one month, …) in the projected coordinate system ‘ETRS 1989 Lambert conformal conic projection’. Precipitation data serves as an important base for water balance analyses. The latter is usually balanced according to the water year (discharge year, hydrological year), starting on November 1 and ending on October 31 of the following year. This classification is used as late autumn and early winter precipitation is stored as snow or ice and does not run off until the following spring. With the release of HYRAS-DE-PRE version v5.0 in December 2022, the DWD has extended the available data sets. They now also include water balance periods (water year, winter half of the year, summer half of the year), which means that this data may be used directly.
Technically, the HYRAS-DE-PRE data is grid data. According to DWD documentation, however, the precipitation data should be considered point data, which refers to the centre of each grid cell (grid point). Precipitation is a physiographic process. Its distribution is continuous and steady. Therefore, the transitions between the different precipitation data points in the individual grid cells should also be gradual. To this end, the source data (1 km x 1 km resolution) was interpolated to a resolution that is ten times higher, i.e. 100 m x 100 m. A Spline interpolation of the type “Tension” with a weight of 1 and a search radius of 4 points was chosen as the interpolation method (cf. ESRI 2019a). This method is a good compromise between smoothing values on the one
hand and representing the original values in the grid points as accurately as possible on the other.
Isolines and isosurfaces were generated from the interpolated 100 m x 100 m grid data using bilinear interpolation (cf. ESRI 2019b). Isolines are lines that connect points of equal value. In relation to precipitation, these lines are also referred to as isohyets, i.e. they connect points of the same precipitation. Isosurfaces comprise the areas between two isolines and thus indicate areas with precipitation within a specific range of values.
Finally, the precipitation for each evaluation period was summed and averaged by area for each block, block segment and road area of the Urban and Environmental Information System (ISU5).