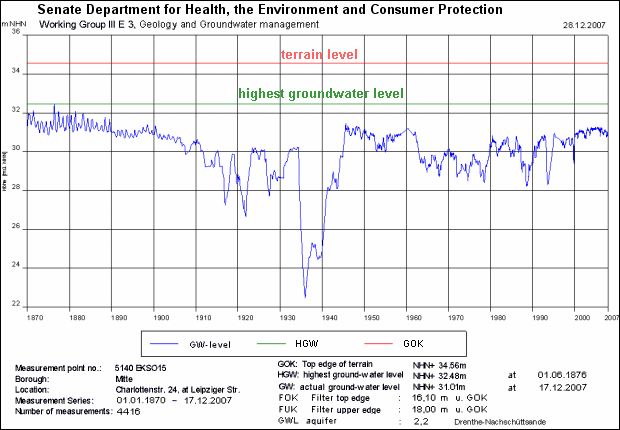
The Berlin groundwater measurement network grew rapidly: By 1937, there were already more than 2000 measurement points. At present, following an optimization of the measurement network in the city, the State Groundwater Service operates approx. 1000 measurement points which are installed into the five different aquifers. The measurement points are equipped with automatic data loggers, and provide daily measurements, several of them by wireless transmission.
In addition, the Berlin Water Utility and the Brandenburg state Environmental Agency as well as other waterworks operators in Brandenburg provide groundwater measurement data for the Berlin area and the surrounding areas, for the most part monthly. If the groundwater has a direct connection to surface water (effluent situation, Fig. 4a), additional level data from surface-water measurement points are used.
The present map incorporates measurements from 1791 groundwater measurement points and 26 surface-water measurement points for the main aquifer (Aquifer 2), and from 38 groundwater measurement points and 5 surface-water measurement points for the Panke Valley groundwater aquifer (Aquifer 1) on the Barnim plateau. At the measurement points which are measured daily, the value of May 15, 2007 was used; for the others, the value taken during the month of May which was closest to this date.
The distribution of the measurement points is irregular: The measurement network is densest in the city center and in the immediate intake areas of the waterworks, and less dense at the outskirts of the city, especially in the surrounding areas in Brandenburg.

