In the areas with open aquifers, new groundwater formation rates correspond to the percolation rates shown in Map 02.13.2. The new groundwater formation rates shown in the map are lower than the percolation water rates in the areas with covered aquifers, depending on the conditions and the reduction factors ascertained. In the areas with covered aquifers, a reduction of at least 18 % (Wuhle) and at most 76 % (Tegel Creek) above the percolation water rates occurs; in most areas with covered aquifers, the new groundwater formation rate is approx. 40 % – 50 % below the percolation water rate.
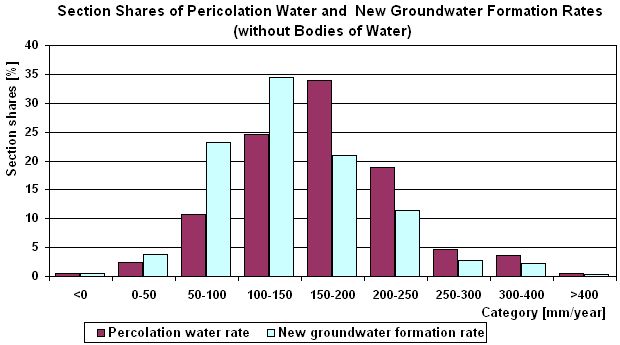
The area shares of the different percolation water rates according to Map 02.13.2 and the derived new groundwater formation rates (Map 02.17) are shown in fig. 2. The category with 150-200 mm/yr. predominates. Due to the reduction in the covered areas, a shift from higher to lower values occurs in the new groundwater formation values, as compared with the percolation water rate, which is primarily evident in the mean values. Thus, the section shares of the category 50-100 mm account for 10.7 % of the percolation water rate, but for only 23.2 % the new groundwater formation rate. On the other hand, the section shares for percolation water rates of the categories above 150 mm are consistently greater than for new groundwater formation rates.


